|
Observation #0: Origins
Observation #1: The Wealth of Nations
Observation #2: The Economics of Democracy
Observation #3: Capital, Labour & Natural Resources
Observation #4: Technological Change
Observation #5: Fiscal Policy in Canada
Observation #6: A Brief History of the Central Bank: UK, USA & Canada
Observation #7: Shadow Banking & the Great Recession of 2008
Observation # 8: Jeremy Bentham
Observation #0: Origins
The Standard Model of Microeconomics (or
Market Economics), specifically 'X' marks the spot, was formalized by
Alfred Marshall at Cambridge University at the end of the 19th and early
part of the 20th centuries. He provided the solution to profit
maximization under perfect competition and monopoly. In the 1930's Joan
Robinson, also at Cambridge, provided the solution for monopolistic
competition but in an interesting intellectual coincidence it was
independently resolved, at the same time, by Edward Chamberlin in the
U.S.A. As will be seen, the Standard Model was then extended into
Welfare Economics (including Externalities) by Arthur Cecil Pigou who
succeeded Alfred Marshall in 1908 as Professor of Political Economy at
the University of Cambridge holding the post until 1943. Thus the
Standard Model of Market Economics could more accurately be called 'The
Cambridge Model'.
Its roots, however, lay in the 'Marginalist
Revolution' of the 1870s. This shifted the focus of economics from the
production and distribution of wealth among social classes - owners of
capital, labour and natural resources - towards the atomized individual
consumer (2.0 Demand) and producer (3.0 Supply). Microeconomics was born
- the budget constrained maximization of consumer happiness and the cost
constrained profit maximization of producers underpins the standard
model.
This Standard Model of Market Economics
served as the foundation for development of the Standard Model of
Macroeconomics by John Maynard Keynes (also of Cambridge) with his 1936
The General Theory of Employment, Interest and Money. Until then
government did not play an active role in managing the economy. Rather,
it was governed by 'the iron law of wages'. As the economy boomed
labour became scarce and wages rose until the economy crashed. As the
economy declined labour was increasingly unemployed and wages fell until
low enough to jump start the economy. There was no government
intervention, no 'social safety net'.
Observation #1: The Wealth of Nations
0.
Introduction
What is wealth? What is a nation? And, accordingly, what
is 'the wealth of nations'? Through time the meaning of these
terms has and
continues to change and mutate.
a) What
is a Nation?
First,
what is a Nation?
I will restrict myself to the
Western European and especially of the English experience which I have
studied in some detail. I thereby confess my relative
ignorance, i.e., lack of knowledge, of the evolutionary
experience in other regions of the world.
From Tribe to Empire & Back
Once upon a time a Nation was a 'tribe'. A people of the same ethnicity, language and religion - a
whole people but one often made up of different clans. Ancient Egypt, China, Persia and Greece were such
nations; anyone outside was 'a barbarian'. Rome, on the other
hand, began as a tribe - the Latins - but ended up an Imperium in
which citizenship was not limited by blood, birth, language or
religion.
The
modern Nation States of Europe recapitulated Rome beginning as
Germanic and other tribes - Bavaria (Bavarians), the Burgundians (Burgandy), the Franks (France), the Helvetica (Switzerland),
the Lombards (Lombardy), the Swabians (Swabia), the Saxons (Saxony),
the Magyar
(Hungary) and the Russ (Russia). Some then collasced and evolved
into European colonial empires transformed after WWI into Nation States
(a term not introduced into American English until 1919) and more
recently into
the pan-national
European Union, sometimes called the second Roman Empire.
England
From Divine
Right to Throneworthiness
Along
the way, a related question arises. Is a Nation a land, a
people or a king or queen? David was anointed King
of Israel.
So says the Old Testament. This served, in the West, as the basis
for the
Divine Right of Kings. The Church of Rome,
however, separated the secular powers of the King (or Emperor) from the spiritual
power given to St. Peter by Christ in the New Testament: "Pay unto
Caesar what is Caesar's and unto God what is
God's". The opposing principle called caesarpapism
merged the spiritual and secular roles in the Eastern Roman
or Byzantine Empire. Henry VIII of England
reverted to caesarpapism by returning the spiritual power to the King as
head of the Church of England in 1534. One implication
of the Nation as Monarch was that through marriage the
territorial limits of a nation could, and often did, change. A more extensive description is available in
my article:
Christianity,
Censorship and Copyright in English-speaking Cultures.
However,
the people of England during its Civil War (1642-1651) answered
the 'Divine Right of Kings' in 1648 by beheading King Charles
I and starting the first modern republic, the short-lived
Commonwealth of Oliver Cromwell.
The argument was based on the ancient Anglo-Saxon law of
throneworthiness. Kings were elected according to how much
rape, pillage and spoils they could deliver (MacDougall
1982). Ironically 1648 was also the year in which the
Treaty of
Westphalia (actually a series of treaties ending the
Thirty Years War)
was signed. In brief, it birthed the modern Nation-State as a
sovereign geographic entity in which minority religious rights of
Christians - Protestant or Roman Catholic - were secure from secular and
religious persecution. Non-Christians had to wait until the mid-20th
century.
From the
Scientific to the Republican Revolution
The Commonwealth (1649-1660), however,
was followed by the
Restoration of the monarchy in 1660
becoming a constitutional monarchy with
the
Glorious Revolution of 1689. These
events were accompanied by the
Scientific Revolution. Unlike
other European states, England during the
Reformation split not two but three ways –
Protestant, Catholic and Anglican or Church of England. It was in these
troubled times that
Francis Bacon
in his 1605 Of the Proficience and Advancement of Learning Divine
and Humane began his call to Scholars to come down
from their ivory towers into the workshops of Mechanics to practice the
instrumental experimental scientific method and force Nature to reveal
her secrets. Fifty years later at the height of Cromwell’s Commonwealth
Robert Boyle provided the metaphysical rationale for this new
‘experimental philosophy’ placing the laws of the Nature in stasis
above and beyond human and divine intervention. God having created the
world set His Laws in motion and withdrew, no more miracles or divine
intervention. He left, however, a second book, the
Book of Nature, that had to be red and all of Nature was therefore the legitimate subject of experimental
philosophers. This was the ‘Latitudinalist compromise’ (Jacob
1978). Its logo was Newton’s clockwork universe running on the
calculus of motion. Secular and religious legitimacy for
experimental philosophy was granted by Charles II's charter to the Royal Society
of London for the Improvement of Natural Knowledge in 1662 (Jacob
1978;
Jacob & Jacob 1980). Theologically, this Revolution
placed the material world beyond the opinion of popes, priests and
philosophers. No longer would hot or cold be determined by the
personal whim of a superior but rather by the thermostat. The
machine became the measure of all things physical leading to Instrumental Realism (Idhe 1991).
The first successful Republican
revolution was the American of 1776. It overthrew an ancient regime of
subordination by birth but nonetheless adopted many of the Common Law
legal traditions and precedents of their ancient masters especially
business law and most importantly, intellectual property rights like
copyright, patents and trademarks.
Henceforth, however, the individual, not the family, clan or
bloodline would be the lodestone of society. This marked the
culmination of a process beginning with the
artist/engineer/humanist/scientist of the 15th century European
Renaissance. The individual through creativity and talent erupted out
of anonymity into celebrity. It continued during the Protestant
Reformation of the 16th century when the individual was linked directly
to the godhead without intermediation by pope, priest or philosopher.
It accelerated with the Scientific Revolution of the 17th century with
the ‘experimental philosopher’ who William Whewell, at the request of
the poet Samuel Coleridge,
renamed ‘scientist’ in 1833 (Snyder 2000) and continued with the
'author' in the 18th century, the 'inventor' in the 19th and the
business 'entrepreneur' of the 20th century. This is known as the western
Cult of Genius.
The second Republican revolution,
the French of 1789, threw out not just feudal overlords but also common
law and religion. The French Revolutionaries re-thought Law from a
Republican, secularist perspective. Like the Americans, they made the
Individual, the Natural Person, the cornerstone of the political and
social order. Thus the American Declaration of Independence announces:
“We hold these truths to be self-evident, that all men are created
equal, that they are endowed by their Creator with certain unalienable
Rights, that among these are Life, Liberty and the pursuit of
Happiness”. The French Declaration of the Rights of Man and the Citizen
of 1789 (Article 2) arguably goes further declaring: “The aim of all
political association is the preservation of the natural and
imprescriptible rights of man. These rights are liberty, property,
security, and resistance to oppression.” [emphasis added]
The term natural indicates that Nature, not some
divinity, is the scientific source from which these rights flow in an ideological
sense. The word ‘ideology’ has many meanings today (Gerring 1997) but
was coined simply enough by Condillac in 1797 to mean ‘the science of
ideas’ (OED, ideology, 1b). Separation of Church and State was critical
to both American and French revolutionaries but the French were atheists
while the Americans were theists. A secular science of ideas to counter
the awe and mystery of religious and metaphysical thought and ritual was
part of the French revolutionary agenda to complete the overthrow of the
ancient regime.
In this sense an ideology is a 'secular' theology explaining the
way the world works but without any necessary reference to a divinity.
The
term imprescriptible indicates that no contract infringing such
rights, even willingly signed, is enforceable by the courts, i.e., they
cannot be signed away. They cannot be assigned, transferred or waived in favour of a Proprietor – Natural or Legal. The difference between
Anglosphere Common Law and (what began as the Napoleonic Code but
evolved into) the European Civil Code with respect to intellectual
property is arguably one of the hottest international trade
controversies - Disney vs. France, the United States vs. the 2005 UNESCO
Convention on Cultural Diversity, etc. As I argue
elsewhere, with respect to intellectual & cultural property the American is an
unfinished Revolution. Please see my
Preface: Intellectual & Cultural Property - Cult of the Genius.
There was in fact five major waves to the Republican
Revolution: (i) the English
Revolution or ‘Great Rebellion’ of 1640; (ii) the American
Revolution of 1776; (iii) the French of 1789; (iv) the Latin
American Bolivian Revolution of the early 19th century; and, (v) Sun Yet Sen's Chinese
republican revolution of the early 20th century. In all cases
they were betrayed. In the first, the monarchy was
restored in 1660 and the ‘Glorious Revolution’ of 1689 was
required to establish a ‘constitutional’ monarchy. In the
second, the definition of ‘Man’, or Natural Person, was limited
to white males (sometimes called the ‘pale penis people’). In
the third, terror was justified in the defense of liberty. In
the fourth, a caste system - with descendents of European
conquistadores at the
top, mixed bloods in the middle and indigenous peoples at the
bottom - was erected. And the fifth was swept away by the
Communist Chinese Revolution of 1949.
Progressively, however, the franchise has been extended to all
Natural Persons as citizens, discrimination under the law has
been progressively eliminated and the concept of human rights
become engrained
into the polity.
The concept of 'a
republic', of course, dates back to ancient Greece and Rome. The
modern republic, however, is grounded, more or less, not on common ethnicity, language or religion, but on
'the people' as a whole including all those born within the territorial
limits
of a Nation State (even the children of immigrants). Today,
the vast majority of humanity takes for granted that 'the people'
constitute the Nation even if a 'constitutional monarch' wears a token Crown. This
is the triumph of democracy. Furthermore, with
the end of the Market/Marx Wars the Communist Revolution
collapsed. The previous Republican Revolution survives and a
world divided and threatened with nuclear winter for almost half
a century because of a domestic feud between two schools of
economic thought now rallies around the last ideology standing – market
economics with its political and legal corollaries: popular
democracy and private property.
For our purposes
macroeconomics functions at the level of the Nation State.
For further information about the shifting sands of sovereignty on which
it stands, please see: Chapter
13.0 The Nation-State, of my dissertation
The Competitiveness of Nations in a
Global Knowledge-based Economy.
b) What
is Wealth?
If
the meaning of Nation has changed through time, the meaning of wealth
has also transformed. The
common meaning of the word wealth as given by the Oxford Concise
Dictionary is: n. riches, large possessions, opulence; being
rich; abundance; a profusion or great quantity or display. A
subtext to the definition, however, is more revealing. By subtext, I mean, in this case, the etymology or
origin of the word. In the case of wealth the
OED says: Middle English from well and weal, after health.
And hence the concept of the 'commonwealth'.
In
a subsistence 'hunter gatherer' economy, wealth is easily defined.
In very simple terms, anyone with lots of food and other requirements
for survival is wealthy; anyone without is poor (and usually unhealthy and
soon dead). The Agricultural Revolution generated a significant
surplus in the food supply permitting a higher order of
division and specialization of labour than possible in a hunter gatherer society. Wealth began to
include not just the necessities but also 'luxuries' like jewelry,
precious stones and metals as well as land, skilled craftspersons and
great buildings. An often overlooked parallel to the Agricultural
Revolution was the 'Maritime Revolution', e.g. of the Amerindian culture
of the northeast coast of North America (known as the
Maritime
Archaic
culture) which 7,000 years ago enjoyed a significant food surplus through
command of the seas. It has even been suggested that
they sailed to Europe. With the Industrial Revolution
and steam power, the
concept of wealth changed yet again. This time it expanded to
include manufacturing facilities vastly more complicated and diverse than
the water and wind mills of the Agricultural Revolution and, in a sense,
beyond human scale. It
also ushered in a new form of wealth in the form of equity shares in
limited liability corporations rather than outright ownership.
c) What
is the Wealth of Nations?
Until the 1930s there was no 'macroeconomics'.
There was no 'national economy'. In
effect, there were two relatively disconnected sectors: government (the monarch
and/or Parliament) and the private sector (the people). The
economy went up and down ruled by the
iron law of wages. As the economy boomed labour became scarce and wages
rose until the economy crashed. As the economy declined labour was
increasingly unemployed and wages fell until low enough to jump start
the economy. There was no government intervention, no 'social
safety net'.
Here is a timeline for the changing
meaning of the wealth of nations:
i -Mercantilism: 16th to 18th Century
At first this disconnect reflected the vision of the
Nation
as the private concern of a monarch and was 'proprietary' in nature. The
monarch or Parliament was politically 'absolute' and economic policy was
Mercantilist.
How much gold, silver, land and slaves (or serfs) was the measure of national
wealth. Sell as much and buy the least from foreign countries and build up
ones bullion reserves. The people consisted of serfs, slaves, servants,
commoners, soldiers and vassals
or aristocrats - dukes, counts, barons, etc - who swore allegiance to the monarch
who, in turn, made demands of, and granted privileges to them. National
economic policy consisted, initially, of Crown grants of monopoly privilege to the
monarch's favorites to fund the monarch's scheme,
palaces, ventures and wars while taxes approved by Parliament were levied on the
general population - including a head tax - to finance domestic peace, order and
good government. Little concern was given to the well-being of 'the
people'.
ii -
Classical: 1776 to 1870's
By the end of the 18th century,
democratic government - constitutional monarchies and republics - arose. However, in response to the excesses of monarchial
interference with the economy during the
Mercantilist
period,
laissez
faire (let the entrepreneur decide what to produce and not the Crown) &
laissez passer (let workers move to work where they want, not to where guilds assign them) became the norm, that is, limited involvement by government
in the economy. The central economic concept, however, remained 'class' and the
question was the division of national income among the classes. Thus, on
the one hand, the politics
of the Republican Revolution made the individual as voter the foundation of
the polity, in
classical economics class remained the primary unit of analysis.
It was also believed that the market would self-adjust
the business cycle. The mechanism of adjustment was called the Iron Law of Wages. If workers earned more they would simply breed increasing the
number of workers and thereby forcing wages down to a subsistence level.
If wages were too low, workers would not reproduce reducing the number of
workers forcing wages up which, in turn, would lead to more workers with wages
again falling again to the subsistence level and so on.
By the mid-19th century 'Socialism'
arose. Beyond Karl Marx & the Boys (Lenin, Stalin, Mao,
Fidel, Pol Pot, et al), however, there are many forms of socialism
with differing views of the relationship between 'the working class' and the rest
of society. The history of the Labour Movement demonstrates such
differences, e.g., the
Knights of Labor. the Industrial Workers of the World or "Wobblies",
Fabianism with its concept of Industrial Democracy, Syndicalism, Gomperism
or business unionism,
etc.
What they share in common is a focus on class - the working class hero
of John Lennon - not the
individual.
iii - Neo-Classical: 1870 to
1936
Beginning in the 1870s the
Marginalist Revolution
in economic thought made the atomized consumer and
producer maximizing utility and profit, subject to the constraints of budget and
price/cost. Its vision could be expressed in
deductive logic based on simple assumptions and demonstrated in words,
calculus (numbers) and geometry (graphs) satisfying Descartes'
definition of a 'science'. It represented the marriage of the
felicitous calculus of Jeremy Bentham and Newton's calculus of motion.
In many ways it is the economic flip-side of the Republican Revolution
doing away with 'class' in classical economics including Marxism and
replacing it with the atomized constrained maximizing individual as
consumer/producer. It also explains, among other things, why
the Market/Marx Wars ended the way they did. It is the individual,
not class, that matters because we are always both
consumer and producer. For more information, please see my
notes on
The Marginalist Revolution.
It was, however, the height of the
European colonial empires that remained Mercantilist internationally
with a laissez-faire domestic market. These attempted through colonies to
become self-sufficient with respect to resources and markets. They
strived for
autarky. No truck nor trade with the enemy unless absolutely
necessary.
iv -
Keynesian 1936 to 1970s
Belief in the
self-adjusting power of the marketplace continued to dominate economic thinking
until the
Great
Depression of the 1930s. The economies of the industrialized world did
not self-adjust to the first synchronous global downturn. Before if
Germany was depressed France was inflated or if Britain experienced a downturn
the the U.S. boomed while Japan continued to industrialize and joined the crowd.
All national economies sank at the roughly the same time. Unemployment was very high (25-30%); social
unrest and revolution was in the air. Many considered that
Fascism
in Italy,
Nazism
in Germany,
Communism
in Russia and the Imperial Japanese 'Co-Prosperity Sphere' offered answers to the suffering of the
people. All were essentially authoritarian, racist and totalitarian
in nature. In this sense the Second World War was in fact as much a war
against racism as fascism. Furthermore, like the European colonial empires
on which the sun never set, they advocated autarky rather than the
comparative advantage of international trade
to
answer the global economic crisis. In this regard, the Cold War
represented a similar attempt to attain autarky - no truck nor trade with the
Commies or Capitalists, depending in which Bloc one lived.
The liberal democracies desperately sought an
alternative. In politics, the United States elected
Franklin
Delanor Roosevelt as President in 1933 on the platform known as the 'New
Deal'. In economics,
John
Maynard Keynes offered a new view of the economy requiring government to
play an active role without exerting ownership or requiring corporatist
dirigisme and retaining the free market as the primary economic institution.
Macroeconomics
was born. It is Keynes' model that we will examine in this class. It
is arguably the 'standard model' of macroeconomic thought because even its
critics use the same instruments of analysis introduced by Keynes and his
successors. It focuses not
on class or the individual consumer/producer but rather on functional aggregate
categories such as households, consumption, savings, investment, government expenditure,
etc. For more information, please see my
notes on
The Keynesian Revolution.
v - Post- Keynesian
1970s to ?
By the late 1970s Keynes' belief in
government's ability to 'fine tune' the economy and the efficacy of its
'fiscal policy' - tax and spend - was questioned for reasons discussed
later in this course. The policy focus shifted to the Monetarists who
emphasized the role of the central bank in manipulating the money supply
and the cost of money or the interest rate (r) to fine tune the
economy. Similarly, fiscal policy was seen as inherently
limited by the Rational Expectationalists who took exception to Keynes'
key assumption about workers' price expectations resulting in sticky money wages -
a subject to be discussed later in the course. With the recent
'Great Recession', however, a mixed Keynesian/Monetarist economics is
being tested: Can brute monetary intervention together with limited government
expenditure stimulus prevent another Great Depression? Its
competitor is the the Austrian School of von Hayek and von Mises that
argues the economy should simply be allowed to clear out bad investments made by
producers and consumers with no government intervention. Another critical difference with the 1930s is there is no viable
ideological alternative to market economics. It is the last
ideology standing.
2.
Global Knowledge-Based/Digital Economy
Please see the linked
historic exhibit.
Please see my
recent article:
Disruptive Solutions to Problems associated with the Global
Knowledge-Based/Digital Economy. Please see
my dissertation:
The Competitiveness of Nations in a Global Knowledge-Based Economy.
More will be said about this emerging economy and the role of
intellectual property rights (IPRs) - copyright, patent, registered industrial design,
trademark, 'know-how' and trade secrets - later in the course.
Arguably, IPRs represent wealth in the global knowledge-based economy.
Unlinked Reference
MacDougall,
H.A., Racial Myth in English History: Trojans, Teutons and
Anglo-Saxons, Harvest House, Montreal,
1982.
Observation #2: The
Economics of Democracy
Keynes believed that the business cycle reflected the
fickle 'animal spirits' of investors alternating between Fear & Greed.
He called on Government to compensate for these mood swings relying on
'the multiplier'. But how stable is the mood of Government?
Can it be relied upon to make sober, sensible decisions? Is it, in
turn, subject to 'animal spirits'?
There are three actors in the economics of democracy:
voters, politicians and bureaucrats. Each has its own 'objective
function' which its strives to maximize subject to constraint.
Ideologically every polity can be characterized by colours in two
dimensions. Horizontally, there are Blues - conservatives,
monarchists, fascists, etc. and then there are Reds - liberals, social
democrats, communists, etc.. Vertically there are Browns -
techies, engineers, mechanists, etc. and, then there are Greens -
ecologists, nature lovers, romantics, etc. One can thus have Red
Greens (Green Peace) as well as Blue Greens (Sierra Club); Red Browns
(Communist apparatchiks and nomenclatura) and Blue Browns (Nazis
technicians 'just following orders'). At the extreme, one can also
have Blue Reds when far Left (e.g., the Party as vanguard of the
revolution) turns into far Right (e.g., the dictatorship of the
proletariat) or vice versa.
Arguably the seminal text in what today is called 'rational
choice theory' was published in 1957 by
Anthony Downs: An Economic Theory of Democracy. Other
economists have followed as have other disciplines including Law and
Political Studies. For our purposes there are three primary
actors in the public policy process:
i -Voters;
ii - Politicians; and,
iii - Bureaucrats.
i - Voters
The objective function of the voter is maximizing
utility when that function includes Equity, Externalities and Public Goods. They are constrained primarily by what
is alternatively called Rational
Apathy
or
Ignorance.
If one is to be an informed voter one must learn about the issues - time
& effort. Having determined the issues one must then decide where
one stands - time & effort. Having decided one must chose the
politicians who reflects one's views - time & effort. Having
selected the candidate one must get out and vote - time & effort.
Time & effort represent costs to the voter who unless strongly motivated
is rational to be apathetic and stay ignorant of the issues and stay at
home on election day. This is why we say a government is not
elected but rather defeated. Thus in federal elections only about 60%
turn out to vote; in provincial elections only about 50%; in municipal
election about 10%; and for school and hospital board elections only
about 1% get out and vote. This has significant
implications. Taking just the federal level it means that 30% of
the electorate can elect a majority government which can use the
'notwithstanding' clause to abrogate any of those rights and freedoms in
spite of the courts. The same
'notwithstanding' clause
holds for the Provinces but where
only 25% can elect a majority government. This reflects what
Jeremy Bentham called "legislative omnicompetence" - the supremacy of
the House of Commons under Parliamentary democracy.
Another characteristic of voters (and citizens in general)
is adverse selection. This is most apparent in the case of
insurance. Adverse selection occurs when one's demand is related to one's risk but
the insurer cannot adjust pricing. This may occur
because risk information is known only to the individual (information
asymmetry), or due to regulations or social norms
preventing the insurer from using certain information to set
prices, e.g., gender, ethnic origin, genetic test
results or preexisting conditions. The latter case it is
called "regulatory adverse selection". Thus if an insurer does not
vary prices according to smoking status, life insurance is a better buy
for smokers than for non-smokers and smokers will be tend to buy more
insurance than non-smokers. For the insurer the higher mortality
of smokers is adverse. Something similar happens in politics.
If one is unemployed one will tend to vote for the politician promising
government intervention which raises the cost of government.
Yet another characteristic is moral
hazard.
Economist
Paul Krugman describes moral hazard as "any situation in
which one person makes the decision about how much risk to
take, while someone else bears the cost if things go badly." For example, bank
bailouts by governments, central banks or other
institutions may encourage risky lending in future because those taking
the risk believe that they will not have to bear all the losses.
Fire insurance is another example. One buys fire insurance to
cover losses but by insuring against fire one may be tempted to commit
arson to collect the insurance payout. Politically, similar
problems have been associated with government programs as noted by
Rational Expectationalists, e.g., the American urban homesteading
program.
ii - Politicians
The objective function of politicians is to get elected or
re-elected. They are constrained primarily by Arrow's
Impossibility Theorem.
If a politician receives 51% support on every issue in an election
campaign that politician looses the election! Why? Rational
Apathy. The 51% comfortable with the politician's position tend to
stay at home in large numbers while the 49% opposed are motivated and
turn out and vote. Again this is why we
say a government is not elected but rather defeated.
This encourages politicians to take a
middle-of-the-road position on most issues thereby avoiding painting a
target on their backs. Similarly political party platforms tend to
avoid alienating voters by taking
a middle-of-the-road position,
until Trump. Edifice Complex
iii - Bureaucrats
The objective function of bureaucrats is 'steady as she goes',
'no waves'. The bureaucracy should run like a fine tuned engine.
There are two distinct types of bureaucracies - political and
professional. In the U.S. all positions from the director level to
Secretary of State are political appointees. Each serves at the pleasure
of the sitting President. This is part of the political spoils
system. It is relatively easy to appoint loyalty over competence.
In the parliamentary democracies like Canada there is a profession
public service that fill positions from clerk up to deputy minister.
Theoretically competence is valued over loyalty to the party in power.
In both cases bureaucrats are constrained by politicians and voters.
It is, however, of the parliamentary democracies of which I coined the Three Laws of Technocracy.
Two qualifications: first, they are based on my career experience;
second, the term 'technocracy' was coined by
John Kenneth Galbraith to explain large
corporate bureaucracies. To the degree competence is the
test in both the following apply to both.
The bureaucrat can relax the constraints in three ways:
Confuse & Conquer
A minister in government is generally
not
a specialist in the subject area. The professional
bureaucrat usually is. When the politician proposes a new policy
that will make waves for the bureaucracy the bureaucrat can make the
question so complicated that the politician backs off or leaves it to
the bureaucrat - confuse & conquer. The self-regulating
professions are similarly capable of making an issues so complicated the
client leaves it to their better judgment.
What We Don't Know Won't Hurt Us
For all the talk about freedom of information the reality
is the bureaucrat and the politician often practice 'What we don't know
won't hurt us!' With information politicians and voters may ask
questions that require the bureaucracy to answer creating waves and
causing the fine tuned engine to stutter. If information is simply
not collected then questions cannot be asked and therefore there is no
need to answer. No waves. No stutter. Real world
examples abound!
When in Doubt Privatize
One aspect of parliamentary democracy is
the role of the Auditor General who is an officer not of Her Majesty,
i.e., the executive branch, but rather an officer of the House of
Commons. The office was originally established to ensure that tax
revenues authorized by the House were used
by the Crown for their voted
purpose. If, however, a Crown Corporation is established
or an activity is privatized but financially supported
by the government
then the cloak of commercial confidentiality falls over
its financial operations and the Auditor General usually does not have
authority to check the books. In fact the most powerful form of
privacy in a capitalist system is commercial
confidentiality.
Observation #3: Capital, Labour & Natural Resources
Capital (K)
The
definition of capital is an unresolved problem in economics. To Marxists, it is
theft. To the mainstream, its definition remains problematic as noted by T.K.
Rymes of Carleton University in conversation with the author in the early 1970s:
“If there is no theory of capital, there is no economics. And there is no
theory of capital!”
The concept of capital has
mutated and expanded through history. To the Mercantilists of the 17th century,
capital was gold, silver, land and slaves. To the Physiocrats of
pre-Revolutionary France, it was the surplus generated by agriculture. To the
Classical School of the late 18th and early 19th centuries, it was the surplus
resulting from the division and specialization of labour. To the Neo-Classical
School of the late 19th and 20th centuries, it was financial capital as well as
physical plant and equipment. To Bohm-Baverk and
the Austrian School, capital was historically embodied labour produced through
‘round-about’ means of production (Blaug 1968, 510-11). How to measure such
embodied labour has never, however, been satisfactorily answered (Dooley
2002).
Today, when
economists speak of capital, they may refer to cultural, financial, human,
legal, physical, social or other forms expressed as a stock, e.g.,
physical plant and equipment existing at a given moment in time.
For my purposes, capital is codified and tooled
knowledge, i.e., knowledge fixed in an extra-somatic matrix.
Alternatively, capital is “knowledge imposed on the material world” (Boulding
1966, 5), or, “frozen knowledge” (Boulding
1966, 6). It includes:
codified knowledge in the form of human-readable
information management systems and databases, operating manuals and libraries as
well as associated intellectual property rights such as copyrights, patents,
registered industrial designs and trademarks; and,
‘hard-tooled’ knowledge in the form of physical
plant and equipment, i.e., sensors and tools, plus related ‘soft-tooled’
knowledge including machine-readable computer & genomic programs, standards and
techniques.
Codified and tooled knowledge are fixed in material
form; both have vintage; both are extra-somatic, i.e., they exist outside
the natural person. I will now briefly examine softer forms of capital -
cultural, financial, human, legal and social - expressed as codified and tooled
knowledge.
Cultural
Cultural capital, as artworks, books, photographs,
plays, recordings, etc., is codified knowledge. As broadcast & recording
studios, conservatories, libraries, museums, parks, printing presses, sets,
props & costumes, theatres and other venues, it is tooled knowledge. In this
sense, cultural capital (codified and tooled) contrasts with cultural practice
or performance which is personal in nature.
Financial
Financial capital as currency, equities, bonds,
mortgages and other financial instruments is codified knowledge, i.e.,
fixed on paper or in human readable electronic format. Anti-counterfeiting
measures such as encryption, electronic strips and chips are forms of tooled
knowledge. Debit and ‘smart’ cards are contemporary examples of financial
capital as tooled knowledge. In this view, financial capital (codified and
tooled) contrasts with financial practice which, again, is personal in nature.
It is as personal & tacit knowledge, however, that
financial capital plays its primary role. As a generally accepted medium of
exchange, store of value or unit of account, financial capital as money involves
tacit knowledge routinely recognized and accepted by a natural person. In this
sense, financial capital, including the price system (Hayek
1989), is an institution, i.e., a routinized pattern of
collective human behaviour. Like a physical reflex, e.g., riding a
bicycle, a human being learns to recognize, accept and exchange financial
capital. In different cultures and periods of history what constitutes money
and financial capital differs (Humphreys 1969). In other words,
financial capital is a cultural artifact, a form of organizational technology
that is tacit, i.e., ‘generally accepted’ in a society.
Human
Human capital generally refers to the stock of skills
and education possessed by a worker. Given human capital is embodied in a
living human being, there is no extra-somatic component, i.e., there is
no capital as frozen knowledge. The term ‘human capital’ is thus a misnomer.
Human capital is personal & tacit knowledge and somatic to the individual.
Additions to this stock reflect learning, education, experience and training on
the memory and reflexes of the individual.
Legal
Legal capital as law books, statutes, judicial and
quasi-judicial decisions is codified knowledge. Legal capital as court houses,
handcuffs, prisons and police cars is tooled knowledge. In this view, legal
capital (codified and tooled) contrasts with legal practice which is personal knowledge.
Social
Social capital can be codified and fixed on paper or
another human-readable format stating customs and conventions of behaviour,
educational curricula, public rules and regulations as well as public safety
standards, e.g., drinking water standards. Social capital as schools,
hospitals, roads, sewage & water systems and telecommunication systems is tooled
knowledge. In this view, social capital (codified and tooled) contrasts with
social practice including market sentiment which are persona knowledge.
Social capital, according to some
scholars, can be extended to include “values and beliefs”. Such values and
beliefs can be codified, e.g., the Analects, Bible, Koran & Vedas.
Alternatively, they can be tooled into monuments and other works of aesthetic
intelligence reflecting an ideology, e.g., socialist realism. Values and
beliefs, however, take on meaning only when practiced or perceived by a living
human being. In this sense, there is no extra-somatic component, i.e.,
there is no capital or asset that can be exchanged for money. Put another way,
“Money can’t buy you love”.
With respect to economics, such values and beliefs
include market sentiments. In The Theory of Moral Sentiments and The
Wealth of Nations, Adam Smith stresses the role of Sentiment in market
exchange, e.g., trust. As Samuels
put it, “the order produced by markets can only arise if the legal and moral
framework is operating well” (Samuels
1977, 197). Together with division and specialization of labour, it
is market sentiments, according to Smith, that assures the wealth of nations.
In effect, Sentiment influences Reason and Reason influences Sentiment including
economic expectations. Put another way: no matter the price, would you buy a
used car from that person?
To the degree that various forms of capital –
cultural, financial, legal, physical and social – can be expressed as codified
and tooled knowledge, one may speak of ‘a knowledge theory of capital’. Such a theory is a corollary to a more general ‘labour
theory of knowledge’.
Labour (L)
In fact there are three forms
of Labour - Productive, Managerial & Entrepreneurial. All three forms embody personal knowledge.
Productive
Productive workers are those on the shop floor actually
producing goods & services. They are concerned with output. Their
knowledge is technical and specialized to a given industry or firm. In
effect they combine codified and tooled with personal & tacit knowledge
(memory and reflex) generally learned on the job in the Anglosphere.
Their knowledge involves making something or making something work. In
this sense the competitiveness of a firm or nation “depends not only on
sensible decisions about what to do, but on the availability of the
skills that are required to do it” (Loasby 1998, 143).
Managerial
Management, among other things, means “a governing body
of an organization or business, regarded collectively; the group of
employees which administers and controls a business or industry, as
opposed to the labour force”. It also means “the group of people who run
a theatre, concert hall, club, etc” (OED, management, n, 6). The role of
management is to make available the means (inputs) so that production
workers can perform their tasks and then to market and distribute the
output. In many ways management is like a choreographer, music or
theatre director. This sense of modern management is caught by Aldrich:
Thus the total operation is a performing art with
blueprints for score or choreography, the difference being that in this
technological case neither the co-ordinated performances (ballet) of the
skilled workers nor the finished product is put on exhibit simply to be
looked at, contemplated. It is a useful performing art. Its value is
instrumental.” (Aldrich 1969, 381-382)
Similarly, according to Schlicht, it is:
the fit of the organizational elements, rather than the
elements themselves, that characterizes a firm. Just as the quality of
an orchestra performance cannot be adequately measured by the average
quality of the performances achieved by the individual instruments, but
depends crucially on the way the instruments are played together, so the
productive value of a firm - as opposed to a set of individual
contracting relationships - emerges from the quality that has been
achieved through mutually adjusting the various activities that are
carried on. (Schlicht 1998, 208)
One crucial characteristic of the firm is custom
including tacit understandings of entitlements and obligations between
productive, managerial and entrepreneurial workers. This constitutes
part of what is commonly called ‘the corporate culture’ for which, on a
day-to-day.
Entrepreneurial
With the notable exception of
firms like Microsoft (Bill Gates) and Walmart (Sam Walton), most modern
corporations do not follow an original founder/owner but rather a ‘hired
gun’, or business entrepreneur. The word ‘entrepreneur’ comes from the
French entre meaning ‘between’ and prendre meaning ‘to
take’. The English ‘middleman’ retains this original sense.
During the Middle Ages and Renaissance, European traders (especially
from Venice and Genoa) ‘middled’, at high risk, between foreign
suppliers, e.g. of silk and spices from the Turks, and final consumers
in northern Europe. Today the term usually refers to someone who
sees and seizes an economic opportunity or a market opening or gap.
This may take the form of a new product or of servicing an existing
market in a new way. In both cases a high degree of creativity and
risk-taking is implicit. In this regard, the first English usage
of ‘entrepreneur’ was in 1828 meaning “the director or manager of a
public musical institution.” Today we would call this ‘an
impresario’. In fact, it was not until 1852 that entrepreneur took
its modern meaning of “one who undertakes an enterprise; one who owns
and manages a business; a person who takes the risk of profit or loss
(OED, entrepreneur, a, b).
Entrepreneurial knowledge is
intuitive in seeing and taking advantage of invariants and affordances
in a market that others do not see. It involves seeing and
realizing a vision of future markets, products and opportunities.
Ignorance is the opposite of knowledge, i.e., want of knowledge.
The non-rational way of entrepreneurial vision was called ‘animal
spirits’ by Keynes (Keynes 1936, 161). Like some ancient
priest-king, the entrepreneur ‘knows’ the future and leads his people
(investors, managers, workers and consumers) into it – right or wrong -
to success or failure. In a manner of speaking, prophets today
seek profits, not souls. Ideally, this highly valued form of
pattern recognition works best as “informed intuition” (Jantsch 1975).
All available information, knowledge and opinion is explicated but then
an intuitive, inductive judgmental vision is conjured up. In a sense,
the business entrepreneur or CEO has assumed the mantle of the Western
Cult of the Genius joining the artist, inventor and scientist.
Natural Resources (N)
Similarly, the definition of what
constitutes a natural resources is constantly evolving.
At first
glance, natural resources have no relationship to knowledge. By
definition, they exist as John Locke said in “the State that
Nature hath provided” (quoted in
Dooley 2002,
4). They are just part of the environment until the knowing mind
recognizes them as useful. Thus oil lay in the ground virtually
untapped until invention of the internal combustion engine. Just
as we recognize a tool by its purpose (M. Polanyi 1962, 56), we
similarly identify natural resources by the human ends we
attribute to them. At a given point in time a naturally
occurring substance is seen as nothing but an environmental
feature. Take a pathway through the jungle one day and you see a
large rock outcrop. The next day, with new knowledge, the same
path leads not to an environmental feature but to a bauxite
deposit that can be converted into aluminum. It has become a
toolable natural resource. Yet it itself has not changed, one
day to the next, rather new knowledge allows us to see it in a
different light. This ‘changed way of
seeing’ is captured by Loasby when he writes:
Menger begins
by arguing that an object becomes a good only when someone
discovers how to use it to satisfy some human need. Goods are
endogenous, created by new connections between human need and
physical or human resources; and their value is derived from the
need which each of them serves and - crucially for this paper -
from the knowledge that it can serve this need and also the
knowledge of how it can be made to do so… The creation of goods,
and of technology, rests on the creation of knowledge, and
therefore on previous uncertainty - or indeed sheer ignorance.”
(Loasby
2002, 6)
Today the most striking example of how new knowledge
transforms environmental features into toolable natural
resources is biotechnology. While advances in analysis
and sequencing now allow researchers (and hence firms) to
experiment with known genetic command codes to build new
drugs, enzymes, pathways, proteins et al, the reality
is that the raw material for biotechnology is life itself –
everywhere and every when. Nature is much older and more
experienced in designing command codes under a wide range of
environmental conditions than emergent biotechnology.
Accordingly Nature has become the object of search by the
biotech industry for
novel code.
This search is called ‘bioprospecting’ and takes two forms:
ethnobiology and ‘original research’ which is
self-explanatory.
Ethnobiology is the interdisciplinary study of how human
societies use or have used flora and fauna to serve human
purpose, e.g., for medical or nutritional purposes.
Its principal sub-disciplines include ethnobotany,
ethnomycology, ethnolichenology, ethnozoology, ethnoecology,
paleoethnobotany, and zooarchaeology. The
Society of Ethnobiology
publishes a journal documenting activities in these fields.
Non-linked references
Blaug, M.,Economic theory in retrospect, Cambridge
University Press, 5th Edition, 1996
Jantsch, E. Design for Evolution, Braziller, NY,
1975.
Observation #4:
Technological Change
What do we mean by technology?
The word ‘technology’ entered the English language only in
1859 according to the Merriam Webster Dictionary
deriving from the Greek techne meaning Art and
logos meaning Reason, i.e., reasoned art. The
Oxford English Dictionary (OED, technology, 1 b) reports
it was re-coined at that time by Sir Richard Francis Burton,
Victorian explorer and translator of the Kama Sutra
(1883), the Arabian Nights (1885) and the Perfumed
Garden (1886).
It was Karl Marx, however,
(1818-1883) who produced the first true philosophy of
technology combining ‘the means of production’ with a
humanist critique rather than simple glorification of
Victorian progress. It is important to realize that the
technological imperative drives Marxian analysis. Class
warfare is collateral damage. This Marxian connection
tainted reception of all subsequent philosophies of
technology in the English-speaking world or Anglosphere.
Arguably, it was the work of Martin Heidegger (a purported
Nazi sympathizer) specifically his 1954 essay ‘The
Question Concerning Technology’ that finally led,
in 1983, to founding the American Society for Philosophy and
Technology (Idhe
1991, 4). Please see the journal,
Techne. Physical technology, to paraphrase
Heidegger, is the enframing and enabling of Nature to serve
human purpose.
In Economics, measurable
technological change only entered the mainstream in 1957
when economist Robert Solow published "Technical
Change and the Aggregate Production Function". In it he presented what is known as
the Solow Residual. It begins with a symbolic
equation for the production function: Y = f (K, L, T)
which reads: national income (Y) is some function (f)
of capital (K), labour (L) and technological change (T).
Subsequently, in 1962, Solow
introduced the concept of 'embodied technological change' in “Technical Progress,
Capital Formation and Economic Growth”. Embodied
technological change refers to
new technology fitted into
actual products
like the transistor in the
transistor radio. By contrast disembodied
technological change tends to spread evenly across an
economy such as improvements in communications and
transportation or what the Victorians would have
called 'Progress'. In addition there is endogenous and
exogenous technological change, i.e., change
resulting from economic imperatives (endogenous to the
economic system) and changes resulting from the work of
independent scientists, inventors and other creators
(exogenous
to the economic system).
Technological change in the
Standard Model of Market Economics refers to the impact of
new knowledge on the production function of a firm or
nation. The content and source of that knowledge is
not a theoretical concern; what matters is its mathematical
impact on the production function. Over the last
hundred years, depending on the study, something like 25% of
growth in national income is measurably attributable to
changes in the quantity and quality of Capital and Labour
while 75% is the residual Solow attributed to technological
change. Yet we have no idea of why some things are invented
and others not; and, why some things are successfully
innovated and brought to market and others are not.
The Solow Residual is known in the profession as the
measure of our economic ignorance. The economic
effects of this residual was called 'creative destruction'
by economist Joseph Schumpeter. The
'residual' is why I became an economist distinguishing,
during my career, between Physical Technology (P) emerging from the
Natural & Engineering Sciences; Organizational Technology
(O)
emerging from the Humanities & Social Sciences; and, Design
Technology (D) emerging from the Arts or what I call the POD
Model of Technological Change.
For more information please see
my:
Creative Destruction: The Economic Meaning of Technological
Change, especially
Exhibit 1: Evolution of the Production Function.
All cost considerations involved in internalizing a process can be
overturned due to changes in technology, e.g., information technology in the 1980s reduced the need for middle management
and resulted in significant 'downsizing' of large firms.
As has been demonstrated, however, new
knowledge has many sources and varying effects. It may be productive,
increasing output on the shop floor; it may be managerial reducing costs or
increasing sales; or, it may be entrepreneurial realizing a vision of future
markets, products and/or other opportunities. It may flow from the natural and
engineering sciences (physical technology), the humanities and social sciences
(organizational technology) or the Arts (design technology). In economic
theory, however, it does not matter what form new knowledge takes; it does not
matter from whence it comes; the only thing that matters, in terms of calculatory rationalism, is its mathematical impact on the production function.
In response to technological change, the production function for
output may shift upwards or downwards, i.e., technology can be lost as
happened with the fall of Rome. The quantity and/or cost per unit output may
increase or decrease. Alternatively, an entirely new production function may
emerge with innovation of new and/or elimination of old products, processes and
techniques. Technological knowledge does not only accumulate; it also withers
away if not transmitted to subsequent generations. The later is most apparent
with respect to traditional craft methods (White & Hart 1990). The process has
been compared by Kaufmann to speciation and extinction in biology (Kauffman
2000 216).
In the 20th century, technological change became recognized as
the most important source of economic growth, i.e., increase in output –
absolutely, or, per capita. Our understanding of such change, however,
remains limited. We do not understand why some things are invented and others
are not; why some are successfully innovated and brought to market, and others
are not. The contribution of technological change has, in theory, traditionally
been treated as a ‘residual’, i.e., after measuring total growth of
output, the contribution of an increased quantity and quality of capital, labour
and natural resources are factored out and the residual is called technological
change. Again, technological change, in this sense, is a residual amounting to an
error term, or, a measure of our economic ignorance. In this regard,
Kaufmann criticizes the Standard Model and suggests such
‘ignorance’ can be resolved using the concept of coevolution and coconstruction
(Kauffman
2000, 222).
Non-linked references
White, B. & Hart A-M, (eds), Living Traditions
in Art: First International Symposium, Dept. of Education in the
Arts, Faculty of Education, McGill University, Montreal, 1990.
Observation #5:
Fiscal Policy in Canada
i - Purpose
ii -
Assumptions
iii - Ground
Rules
iv - Putting the Question
v -
Terminology
vi - Process & Problems in Canada
i - Purposes
Until
the Keynesian Revolution of the 1930’s (put into motion by the
political impact of the Great Depression), the almost exclusive fiscal
concern of Government in ‘liberal democracies’ of the West was
financing and fulfilling ‘political’ objectives – domestic and
geopolitical. Overall, or ‘macroeconomic’ performance was a given,
not an end or objective to be pursued. The market would
‘self-adjust’ and Government would hold on as ‘bust’ turned into
‘boom’ and then into ‘bust’ again riding the tail of the dragon.
People would suffer or prosper according to the timing and dictates of
market prices with little if any assistance from Government
The Classical and Neo-Classical Periods of economic
history thus reversed Mercantilism that had preceded them. From an
economy as a Crown Privilege to be used, regulated and controlled by the
whim and passion of a moody Prince, the economy became forbidden
territory into which a democratic, liberal government dare not tread. In
summary, the progress of Classical and Neoclassical Political Economy
was the withdrawal of the State from the economy with the notable
exception at the beginning of the 20th century of anti-trust or
anti-combines policy – breaking up trusts and monopolies that, like
Government itself, could corrupt perfect competition and foreclose a
‘just price’ in individual markets. As for the economy as a whole,
the rationale was governmental non-interference.
An important political boost to this rationale was
provided by the rise of socialist and communist political power. With
the defeat of Napoleon III in 1870 by Germany, civil war broke out in
France between liberal democrats (Republicans) and the Paris Commune
(Communists). Socialist and communist thought argued that the answer to
the arbitrariness of both Princes and Prices was total public
ownership of the economy in the name of the people. Paris burned and
laissez-faire capitalism, more or less, triumphed. France remains,
however, much more prone to Government economic interference than
Anglo-American cultures. This fear of public ownership was re-ignited
and then made real with the Russian Revolution of 1917 and the
subsequent Civil War ending 1921 with ‘Communist’ victory.
In 1944 Karl Polanyi, brother of the chemist and philosopher of science,
Michael Polanyi, published the first edition of The Great
Transformation. It treats the rise of the self-regulating market and
the decline of traditional social institutions. According to some
scholars this book is of renewed relevance in a post-Cold War world due
to the emergence of a global knowledge-based economy (Block
2001;
Munck 2002).
Since Keynes, however, macroeconomic performance
(including economic growth and price stability) has become an essential,
if still secondary, policy objective of the modern State. The business
cycle has, to a degree, been usurped by a public policy cycle. Enormous
deficit spending during the 1960’s through 1970s was followed by
increasingly strict ‘deficit and debt’ reduction, downsizing of the
public sector during the 1980s and 1990s with ‘surplus’ spending
beginning a new public policy phase in the early 2000s
to burn out in the Great Recession of 2008, also known as the Long
Recession. Austerity - deficit and debt - was the response of
governments around the world. In many ways repeating the mistakes
of the past - the Great Depression. Like the 1930s initial
stimulus was followed by austerity. This time, however, monetary
authorities intervened softening but not reversing the decline with
experiments like quantitative easy of which more later.
It can, however, be argued that the hard lessons learned
in the 1930s were not forgotten even at the height of the
‘neo-conservative’ (so-called in the English speaking world) or
‘neo-liberal' (so-called in France and most of continental Europe)
political movement of the 1980s and early to late 1990s. The ship of
state continued its course towards a ‘welfare state’ in which
Government has a legitimate role to play in the social and economic
development of the nation (see:
Government
by Moonlight). The difference is that many functions assumed by
Government between the 1930s and 1970s have been downloaded to smaller
‘private’ or semi-private vessels. Overall culture, education,
employment, the environment, health care and welfare (or ‘workfare’)
of society and its members as well as economic growth and price
stability remain responsibilities of the post-modern Nation State. Such
responsibilities are, if anything, taking on even greater importance as
‘competitive factors’ in the emerging global economy emerges. The
only questions remaining are: who should deliver such services –
Government, the profit or the nonprofit sector and how should delivery
be monitored? The services, however, must be delivered in an equitable
manner with citizens protected by a ‘social safety net’ that varies
between States but is present, nonetheless, in all, even the most
capitalist – the United States of America.
One of the ironies accompanying the ascendance of
macroeconomic objectives by politically elected Government is that until
the 1970s most universities in North America, and the English-speaking
world in general, did not have ‘departments of economics’. Rather,
the more usual disciplinary designation was “political economics”.
But just as the legitimacy of Government’s role in macroeconomics
affairs reached a zenith not seen since the Mercantilist Period of
economic history, such departments split into separate and distinct
Departments of Economics and Political Science.
The fiscal policy process is as much cultural as
economic, that is, it is a cultural economic phenomenon. The USA
budgeting process (dominated by the legislative branch) is very
different from that of Canada that is different from the United Kingdom
(both dominated by the Executive Branch) that is different from France
that is different from Germany, etc. Each country even has its own
distinct rituals and traditions associated with the fiscal policy
process. For example, in Canada the Minister of Finance is expected to
wear a pair of new shoes while in Britain the Chancellor of the
Exchequer is to use an old beaten up briefcase to present the budget to
the British House of Commons. Accordingly, what follows applies
only in Canada. It is extracted from my longer paper:
A
Radical Analysis of 'Personal' Taxation.
ii - Assumptions
I
begin with five assumptions about the Canadian budgetary purpose. First,
there are two sides to the coin of fiscal policy – pleasure and pain.
The pleasure (including relief from pain) flows from spending public
monies – fiscal policy. Pain flows from collecting private
monies to pay for public spending – tax policy. Like carrot and stick,
a democratic government-of-the-day uses public finance to adjust, adapt
and evolve society and the economy towards its ‘ideological’ goals
and objectives that extend above and beyond macroeconomic growth and
price stability.
Second, the only way
to gain more pleasure without more pain is through a growing economy.
In the long run, however, a growing economy can be maintained only if
public finance does not “kill the goose that lays the golden egg”.
Third, rational
citizens will do their best – in or out of a growing economy - to
minimize their pain and maximize their pleasure through lobbying,
protests and voting.
Fourth, in their
annual budgets, federal, provincial and local governments flip the coin
seeking a politically workable, socially desirable, balance between the
‘heads-I-win’ and ‘tails-you-lose’ of public finance.
Fifth,
the game of public finance is worth playing, at a minimum, because of
‘market failure’, that is:
·
there are some
goods and services (public goods) essential to modern life that cannot
be produced by the private sector, e.g. municipal bridges and roads,
compulsory mass education, contagious disease immunization, national
defense, etc.; and,
·
perfect
competition is not common in the ‘real world’. Usually some players
in the economy (typically a small group or oligopoly) exercise market
power over the price and quantity of goods and services available to
consumers. The existence of such ‘market power’ justifies a public
response including spending, e.g. funding anti-combines agencies, and,
taxation.
iii - Ground Rules
Beyond
the constitutional reality that public finance is conducted in the name
of Her Majesty in right of Canada and in Her right of each of the ten
Provinces, there are five ‘ground rules’ for this annual coin toss:
a) the Constitution establishes, in broad terms - subject to varying
interpretation:
·
on what federal and
provincial governments can spend;
·
by what means they can
raise public monies; and, · in subordinating local to provincial
government;
b)
three legal systems interactively define persons, property and taxation
in Canada:
·
criminal law, the
prerogative of the federal government but with administration shared by
the Provinces;
·
civil law, essentially
the responsibility of the Provinces with Quebec being the extreme case
governed by a variation of the European Civil Code rather than
Anglo-American Common Law as in other Provinces, e.g. torts
(non-contractual damages) based on precedent (Common Law) rather than
principle (Civil Code); and,
·
tax law, a shared
responsibility of the federal and provincial governments;
c) the federal government ‘owns’ the coin through
the Bank of Canada and influences its value through exclusive control of
monetary policy;
d) the federal government can define and redefine what
are legitimate sources of public monies, e.g. income tax introduced
during WWI as a ‘temporary’ war measures act, and, the 1970
amendment to the Criminal Code permitting lotteries (gaming in general
including ‘video lottery terminals’ or slot machines) to become an
increasingly significant source of public monies for the Provinces; and,
e)
the federal government indirectly influences settlement of public
finance disputes with citizens and the Provinces through its prerogative
of appointment to the Federal (formerly the Exchequer Court) and the
Supreme Courts of Canada.
iv - Putting the Question
Subject
to these ground rules, each senior level of government (federal and
provincial governments) annually put the following ‘pleasure’
questions to the people:
·
who or what will enjoy
public funding: the poor and needy; the average citizen; the corporate
citizen; city or rural dwellers; foreigners, i.e. foreign aid; and/or,
abstract policy categories such as education, the environment, health
care, protection of persons and property, etc;
·
what pleasures will they
enjoy, e.g. direct dollars in the pocket (grants in aid), civil service
employment, public infrastructure and essential services, investment
and/or loans in support of private and/or semi-private ventures, and/or
relief from taxation e.g. tax expenditures including refundable and
non-refundable tax credits;
·
how much pleasure will be
allowed, e.g. marginal or significant to the life of citizens –
corporate or individual; and,
·
when will the pleasure be
provided, e.g. weekly, monthly, quarterly, annually?
Similarly,
each government annually puts the following questions about the pain of
public finance - direct and indirect, ‘near’ and ‘voluntary’
taxes - to the people:
·
who will suffer so they
and/or others may ultimately enjoy the pleasures of public spending;
·
what forms of pain must
citizens endure, e.g. corporate, excise, income, near taxes (e.g.
fees-for-service), sales and/or voluntary (e.g. lotteries) taxes;
·
how much pain from any
one and/or all taxes - should one person or any ‘class’ of taxpayers
bare (tax burden);
·
when and by what means should they suffer, e.g., monthly,
point-of-sale, quarterly and/or withholding-at-source; and,
·
at what threshold should the quality and/or quantity of pain
change or stop, i.e. what are the tax brackets?
v - Terminology
Fiscal
policy or ‘public finance’ involves primary political choices, each with its
associated opportunity costs. Fiscal
policy involves answering hard questions about what pleasures to publicly
provide, to whom, how much, and, how to inflict the pain necessary to raise the
required public funds. Attaining
macroeconomic objectives like fostering economic growth and maintaining price
stability provide only a ‘glass ceiling’ above the heated political debate
of making the ‘tax and spend’ choices of each and every Government.
The ceiling, however, has a great deal of flexibility.
The Keynesian Revolution called for spending in bad times and saving in
good times. This is not what
Government did.
From
the 1960s to the mid-1990’s Government around the developed world spent in
good and bad times. In fact, they spent more than they willing to pay in
additional pain to the taxpaying public. So
they ‘borrowed’. Politics
thereby raised the ceiling. The
ceiling only began to come down when ‘deficit and debt’ became the political
mantra of the industrial world and interest payments on the national debt the
largest single and least satisfying pleasure paid for out of the public purse.
By
the late 1990s, deficits were slashed; debt began to shrink; and, social
infrastructure built up over two generations crumbled but fortunately did not
collapse. As the 21st
century begins, the word ‘surplus’ has even re-entered the political
vocabulary. Inevitably,
perhaps, the heat generated by all the public policy spheres rubbing up against
each other is threatening to raise the ceiling once again.
Jockeying to be first to fill its specific ‘deficit’ incurred during
the ‘slash and cut’ of public debt and deficit reduction, each public policy
sphere is raising its profile before the political public.
Collectively, their wants, needs and desires threaten macroeconomic goals
such as economic growth (increasing potential real GDP) and price stability (low
inflation). If the GDP pie grows
and the cost of its slices does not increase then more public pleasure may be
had with no increase in public pain in the form of taxes or interest payments on
the national debt. If not, some
will win and some will lose. It is
to the naming of these various Canadian spheres of political influence that now
I turn.
As
a federation, Canada has had amply time to sort out the naming of these spheres
of public policy. Since at least 1918 with the founding of the Dominion Bureau
of Statistics (now Statistics Canada), the federal and provincial governments
have come to agreement on certain terms. These
became embodied in The Canadian System of Government Financial
Management Statistics (CSGFMS). In 2001 the system became a
victim of globalization and a general decline in the quality of the publicly
generated statistical evidence. One thing is certain, it will take decades
to develop actionable time series.
The FMS
was founded on a modified-cash based system of accounting. Recently,
Canadian governments have decided to move from that modified-cash based
accounting system to an accrual based accounting system. In addition, an
internationally accepted Government Finance Statistics (GFS) manual has
been developed. The GFS
2001 is an internationally accepted accrual accounting framework for
government finance statistics. The
GFS 2001 is also
fully integrated with the United Nations (UN) System of National
Accounts (SNA) framework. Given these changes, the Canadian statistical
system underlying government finance statistics must also change.
Statistics Canada has decided to move towards reporting government
finance statistics on a Government Finance Statistics 2001 (GFS
2001) basis.
In the following I will deal with the original
'made-in-Canada' system. The
CSGFMS was used for purposes of the Fiscal Arrangement Act between the
federal and provincial governments. The CSGFMS was used to calculate, among other things,
equalization payments by the federal government to the ‘have-not’ provinces
of the country. Next to the System
of National Accounts (to which it is fully compatible), the CSGFMS was the most important system of economic statistics in Canada.
For
purposes of illustration please find below top-level CSGFMS terms used for: a)
assets & liabilities of government in Canada; and, b) revenue and c)
expenditure items. These terms are top-level in that each is composed of various
sub- and sub-sub-categories (CSGFMS, Statistics Canada Catalogue 68-506,
Occasional).
CSGFMS
ASSETS & LIABILITIES
|
Assets
|
Liabilities
|
|
1.
Cash on Hand & Deposits
|
1.
Borrowings from Financial Institutions
|
|
2.
Receivables
|
2.
Payables
|
|
3.
Loans & Advances to
|
3.
Loans & Advances from
|
|
4.
Investments
|
4.
Savings Bonds, Treasury Bills & Other Short-Term
|
|
5.
Other Financial Assets
|
5.
Bonds, Debentures & Treasury Bills – Long-Term
|
|
|
6.
Pension Plans, Deposit & Other Liabilities
|
|
|
Excess of
Financial Assets over Liabilities |
|
|
|
REVENUE
|
Taxes |
|
|
1.
Personal Income Taxes
|
14.
Succession Duties & Estate Taxes
|
|
2.
Payroll Taxes
|
15.
Gift Taxes
|
|
3.
Corporation Income Tax
|
16.
Health Insurance Premiums
|
|
4.
Taxes on Insurance Premiums
|
17.
Social Insurance Levies
|
|
5.
Other Taxes on Corporations & Businesses
|
18.
Universal Pension Plan Levies
|
|
6.
Taxes on Certain Payments & Credits to Non-Residents
|
19.
Other Taxes
|
|
7.
Real & Personal Property Taxes
|
Non-Taxes |
|
8.
General Sales Taxes
|
20.
Natural Resource Revenues
|
|
9.
Motor Fuel Taxes
|
21.
Privileges, Licences & Permits
|
|
10. Alcoholic
Beverages Taxes
|
22.Sales of
Goods & Services
|
|
11.
Tobacco Taxes
|
23.
Return on Investments
|
|
12.
Taxes on Amusements & Admissions
|
24.
Other Revenues from Own Sources
|
|
13.
Taxes on Other Commodities & Services
|
25.
Miscellaneous
|
EXPENDITURE
|
1.
General Government
|
11.
Labour, Employment & Immigration
|
|
2.
Protection of Persons & Property
|
12.
Housing
|
|
3. Transportation & Communications
|
13. Foreign Affairs & International Assistance
|
|
4. Health
|
14. Supervision and Development of Regions &
Localities
|
|
5. Social Welfare
|
15. Research Establishments
|
|
6. Education
|
16. General Purpose Transfers to Other Levels of
Government
|
|
7. Environment
|
17. Transfers to Own Enterprises
|
|
8. Natural Resources
|
18. Debt Charges
|
|
9. Agriculture, Trade and Industry, and Tourism
|
19. Other
|
|
10. Recreation & Culture
|
|
vi - Process &
Problems in Canada
a) Components
b) Limitations
c) Wiggle Room
d) Conclusions
a) Components
The
traditional instrument holding government, at the federal and provincial level,
accountable is the ‘Budgetary & Public Accounts Cycle’ or BPAC.
The cycle begins with submission of an annual Budget to the legislature
as well as a set of spending Estimates by agency, department and program.
Together, the Budget and the Estimates form a government's financial plan for
the coming year. The cycle ends with publication of the Public Accounts
reporting actual spending about two years later. What follows has been
extracted and edited from my Government in Canada journal article:
The
1995-96 Federal Cultural Budget: A Case Study in Canadian Government Budgetary
Information.
In theory, the BPAC
permits one to assess if a government is "putting its money where its mouth
is!" Words and numbers are cheap, especially in the heat of political
debate and media glare. All sorts of promises and threats may be made -- but
does government keep its word? BPAC should hold government accountable by making
its actions transparent to the legislature, the general public and all
communities of interest including the cultural and financial communities.
The
BPAC consists of eight separate documents in three distinct sets: the Budget;
the related Estimates; and, the Public Accounts. The three are
published by three different agencies – The Department of Finance, Treasury
Board and the Auditor General – each often using different data and
definitions.
The
Budget
presents the government's financial strategy and consists of four
documents produced by the Department of Finance.
The Budget Speech presented by the Minister of Finance in the
House of Commons; and the Budget Document, expanding upon the Minister's
speech that establish the Government’s strategy; the Budget in Brief,
spotlighting selected budgetary actions; and, the Budget Plan,
supplementing and detailing information presented in the first three, as well as
presenting ways and means motions to be tabled in the House of Commons.
The
Estimates represent tactics
that support the government's strategy. Produced by Treasury Board, the
Estimates report to the House of Commons by Vote, Activity and Program for most,
but not all, federal departments and agencies. Furthermore, the Estimates
define the logistics behind the government's tactics using dollars, person
years, and (less frequently) federal standard objects of expenditure.
The Estimates consist of three documents, one of which (Part III)
comes in multiple volumes:
·
Part I - Government
Expenditure Plan describes
relationships between the Budget Plan and the Estimates;
·
Part II - Main
Estimates describes
resources for individual departments and agencies and requiring spending
authority from the House though a Vote; and,
·
Part III - Expenditure
Plan reports, in 78 separate
volumes, for most federal departments and agencies. Agencies not reported to the
House through Part III generally issue an annual report and a financial
statement, e.g. the Canada Council. Such annual reports are not considered in
this article.
b) Limitations
The
Budget and the Estimates are complex, self-contained documents
drafted by two related but distinct departments of the federal government. Each
has its own objectives, perspectives and priorities. Often similar information
appears contradictory and/or at variance when reported in different documents
and even different volumes of the same document.
Thus, with respect to the Estimates, there are variations for
which there are apparent and sometimes substantive differences. First, with respect to Part I - Expenditure Plan
and Part II - Main Estimates:
-
Part I reports total
planned spending while Part II reports spending authority by parliamentary vote,
i.e. self-generated income is not reported in Part II's bottom-line request of
Parliament;
-
Part I reports spending
external to government, i.e. it does not include interdepartmental and other
transfer costs as reported in Part II;
-
Part I reports reserves
not included in Part II because they will meet requirements as they arise in the
course of the year and will only then be formulated as Supplementary Estimates
requiring a parliamentary vote;
-
Planned reductions
reported in Part I are not reported in Part II because they cannot be acted on
until new legislation is passed by Parliament; and,
-
Some spending authority
reported in Part II is expected to lapse in Part I for reasons ranging from
contractual and weather-induced delays to late delivery of goods and services.
Thus Part I reports federal savings and lapsed spending, not reported in
Part II and, furthermore, such savings and lapsed spending is not attributed to
individual departments and agencies in Part II.
Second,
since 1986 Part II reports only main estimates for both the current and
forthcoming year. But in any given year a government introduces Supplementary
Estimates increasing or decreasing proposed spending. These changes are no
longer reflected in Part II. Similarly, government may not spend all monies
voted by Parliament. These differences too are not reported, year over year, in
Part II.
Prior
to 1986, these adjustments were reported under "forecast estimate" for
the year finishing. While not an actual figure, the forecast allowed some sense
of this year's estimate relative to last year's likely spending. In fact,
previously Part II provided five years of data including three years of actual
spending, one year of forecast and next year's estimate. This change may, or may
not, reflect the ascendancy of commercial chartered accountancy (reporting two
years of data and adjusting definition of expenditure items required by changing
circumstances) and traditional practice in both registered industrial
accountancy (up to ten years of data with constant definition like the banks) as
well as public sector accountancy (at least five years). Nonetheless, credible
statistical trend analysis can only be conducted with at least five years of
data.
Third,
Part III (introduced in 1986) reports for each of 78 individual departments and
agencies in separate volumes. In many cases Part III displays five years of data
including estimated spending for the forthcoming year, forecast spending for
last year and actual spending for the previous three years. But these are
reported only department-by-department, i.e. no single figure for the federal
government as a whole is available in Part III.
Fourth,
federal programs with which communities of interest are most familiar are
usually not reported in the Budget and may not be reported in the Estimates.
Thus, the Estimates report "Votes" of the House of Commons. For
example, grants and contributions under "Cultural Initiatives" (a
program very familiar to the cultural community) are part of "Vote 10 -
Grants and contributions: Canadian Identity Program, Canadian Heritage".
This means distribution within the Canadian Identity Program is, to a great
extent, a ministerial or bureaucratic prerogative and priority. Thus latitude is
provided to officials permitting "back-pocket" budgeting whereby
ministers or bureaucrats may, if they wish, play one group against another
without published information by which they can be held accountable.
Fifth,
there are in excess of 25 consolidated specified purpose federal accounts
reported as a single entry in Part II in the "General Summary" to the Main
Estimates. But these accounts
are not described or even named in Part II. An accounting of these funds
(reduced as planned or not) will be available only in the Public Accounts to be
published in two years.
c)
Wiggle Room
It
is important to appreciate the "wiggle room" provided by these
limitations within the federal Budget and Estimates. The government can, in
effect, quote different numbers to suit different purposes. Consider, for
example, global federal spending. According to Part II - Main Estimates,
total federal spending for all departments, agencies and specified purpose
accounts will increase 2.3% from $161.1 billion in 1994-95 to $164.8 billion in
1995-96. Excluding specified purpose accounts, spending by all federal
departments and agencies will increase by 6.2%. But if one then excludes the
Public Debt Program of the Department of Finance, then spending by all federal
departments and agencies will increase by only 1.7%.
And
if one uses Part I and considers only federal transactions with outside parties
(including public debt payments) and includes planned savings (requiring
parliamentary approval) and anticipated lapsed spending (allowing for reserves),
then total federal spending will increase by only 0.4% over 1994-95.
In
fact of 25 departments and agencies reported in the 1994-95 "General
Summary" of Part II, eleven will increase and fourteen decrease. Thus the
Department of Finance will experience a 19.1% increase while the Public Debt
Program will increase only 17.3%. Accordingly, excluding the Public Debt
Program, the Department of Finance budget will increase 28%.
In
the Budget Plan, however, the Minister does not provide data directly comparable
with the Main Estimates. Rather he claims departmental spending will decrease
19% over the next three years. Because such cuts include "out years"
they are subject to more uncertainty than cuts proposed this year. Accordingly,
one can say federal spending will go up 2.3%, 6.2%, 1.7% or 0.4%, or it will
decline 19% over the next 3 years. Which statement is "true"? Does the
current format for the Budget and Estimates provide accountability and
transparency of the Government to public scrutiny?
d)
Conclusions
To
conclude, consideration is paid to issues of comparability and definition and
how government could be more like ‘business’ with dramatic effects on public
finance.
i -
Comparability
While
the Main Estimates can be used to calculate the federal budget for
any given public policy sphere, more detailed data is available in Part III
which provides estimates for both the current year and the past year as well as
forecast data for the past year and actual data for the previous one, two and
sometimes three years. There are, however, three problems associated with Part
III.
First,
cost is a problem. Together, Parts I, II and III (78 separate reports) cost
$960.85 plus GST. Separate annual reports are also be required for each cultural
agency not reporting through Part III. With Budget documents, the cost (not
including time and effort in adding up data for all relevant departments and
agencies) is well over $1,000.00. This is the minimum price of accountability of
federal spending to public scrutiny. This cost could be significantly reduced if
the pre-1986 format for the Main Estimates was reinstated reporting five years
of data.
The
federal government has, however, made the Budget and Estimates
available in electronic as well as paper format. This does not mean electronic
information is free. Federal policies are, at present, ambiguous and subject to
differing departmental policies. Treasury Board, for example, tends to make
electronic products available to libraries at no cost, while the Department of
Finance applies a cost-recovery policy in some cases, e.g. detailed budget
papers. Parts I and II of the Estimates are now available in electronic
format.
Second,
Part III presents other compatibility problems. Thus while the Participation and
Official Language Support components of the Canadian Identity Program are
reported for five years, sometimes down to the level of grants and
contributions, the Cultural and Heritage Development component is not.
Similarly, Parks Canada and Corporate Management are reported for only this
year's estimates, last year's forecast and one previous year's actual spending.
This inhibits trend line analysis that requires at least five years of data.
Furthermore, while total budgetary requirements of cultural agencies are
reported in Part III for five years, data at the activity level is available
only in Part II - The Main Estimates for last year's and this year's
estimates.
Third,
even if one used all 78 volumes of Part III, data will not necessarily agree
with the Public Accounts for the corresponding year. Formats of the Estimates
and Public Accounts are not compatible.
(ii)
Definition of Management
It
is clear from calculating the federal cultural budget that definition of
management or administration varies between departments and agencies. Without a
compatible definition it is not possible to determine resources directed at
providing the Canadian people with goods and services.
iii -
Definition of Policy Spheres
For
accountability and transparency of government actions to be accessible to any
Canadian or community of interest, government spending in any public policy
sphere such as culture should be reported in one place, at one time and at a
reasonable cost. This would require, of course, formal recognition of
"legitimate" communities of interest not rooted just in geography or
political allegiance but also in "conceptual space" where,
nonetheless, they exist as "real" public policy spheres of influence.
That
this is possible is evident in France with respect to international cultural
relations. Since 1982, the Government of France has required all departments and
agencies to make an annual report concerning international cultural relations (État
récapitulatif des crédits concurrent à l'action culturelle de la France à l'étranger,
No. 82-126 du décembre 1982). The results are compiled and published. A similar
approach is possible in federal cultural as well as all other public policy
spheres.
iv
-
Formalization of a Cycle of Public Accounts
Similarly,
spending consequences of all government actions should be accountable and
transparent to public scrutiny by any Canadian or community of interest. But for
this accounting to happen, it should be reported in one place, at one time and
at a reasonable cost. Reinstatement of the pre-1986 format for Part II - The
Main Estimates would be a useful first step. It would also provide a timeline
supporting trend analysis and therefore measurement of the momentum of
government towards its long term objective, i.e. to fulfill its democratic
mandate. This would require, of course, that actual spending, not just
will-o'-the-wisp promises or threats, be reported.
A
significant second step would be the re-design of all three parts of the public
accounts cycle -- Budget, Estimates and Public Accounts -- using the same
definitions and parameters.
Observation #6: A Brief History of the Central Bank - UK, USA & Canada
I will trace the origins of three central banks, the Bank
of England, the Federal Reserve in the United States and the Bank of
Canada. As will be seen the Bank of England was created to finance
defense spending while both the Bank of Canada and Federal Reserve were
created in response to financial crises. In both – Canada and the
United States - creation of the central bank represented institutional
recognition that the financial community could not be trusted to contain
its animal spirits and ‘excessive exuberance’ while Government could not
be trusted to keep its hands off the printing press. The central bank
arguably represents a 4th order of Government - executive, legislative,
judiciary and central bank. It marries Government to Finance in a
capitalist economy.
i - The Bank of England
Founded as a private corporation in 1694 the Bank of
England was intended to finance defense spending and serve as the
Government’s banker and debt-manager. By contrast the Bank of Scotland
(also a private corporation) was founded in 1696 to support Scottish
business. It was the first bank in Europe to print its own banknotes
and continues to do so.
By 1781 the Bank of England had effectively become ‘the
banker’s bank’ accepting deposits from and providing services to other
banks. In 1844 the Bank Charter Act linked banknotes to gold
reserves and the Bank of England was granted the sole right to issue
banknotes in England & Wales. An exception was made, however, for
private banks that previously enjoyed that right. The last private
banknotes in England were issued in 1921. Nonetheless, certain Scottish
and Irish (Ulster) private banks still retain this right. It should be
noted that their banknotes are not technically legal tender but rather
promissory notes like cheques.
In 1870 the Bank of England was given the additional
responsibility for interest rate policy. Then in 1890, during a severe
financial crisis, centred on the Baring Bros Bank, the Bank of England
became ‘lender of last resort’ in order to stabilize the financial
system during such financial crises.
From its foundation in 1694 until 1946 the Bank of
England was privately owned and operated. Under the post-war Atlee
Labour government, however, it was nationalized and until 1997 was
state-controlled. In 1997 under the Blair Labour government the Bank of
England again became a privately held corporation and was granted
operational independence over monetary policy in the United Kingdom.
ii - The Federal Reserve of the United States
The first Bank of the United States was created in 1791
by an act of Congress to serve, like the Bank of England, as the
Government’s banker and debt-manager. Like the Bank of England it was a
private corporation. Unlike the British, however, it was intended to be
a truly national bank. In 1811 its charter lapsed and Congress, for
regional political reasons, failed to renew it.
In 1816, the second Bank of the United States was created
primarily in response to government debts incurred during the War of
1812. Its charter was for 20 years but in 1833, again for political
reasons, President Jackson issued an executive order ending deposit of
federal funds which instead were placed in state chartered banks. After
its charter expired in 1836 it became a purely private bank and then
went bankrupt in 1841.
A series of financial crises racked the United States in
the mid- to late 1800s climaxing with the 1907 Panic known as the
Banker’s Panic. It led to runs on all banks and the entire financial
system appeared near collapse. A white knight appeared, however, in the
guise of financier J. P. Morgan, one of the richest men in America.
Organizing other New York bankers and industrialists like John D.
Rockefeller – the richest man in America - Morgan pledged enormous sums
of his own money to stabilize the financial system.
While many in industry and government praised Morgan for
his initiative many were gravely concerned that the fate of the nation’s
finances rested on self-interested private charity. Accordingly in
1908 Senator Nelson W. Aldrich established and chaired a commission to
investigate and propose solutions. This led to creation of the Federal
Reserve System in 1913.
Unlike the Bank of England and the Bank of Canada the
Federal Reserve is regional as well as national in character. There are
12 district federal reserve banks in Atlanta, Boston, Chicago,
Cleveland, Dallas, Kansas City, Minneapolis, New York, Philadelphia,
Richmond, San Francisco and St. Louis. The regional character of the
system allows variations in monetary policy deemed appropriate for the
differing economic conditions in the various regions.
In addition to the 12 regional Federal Reserve Banks with
their own managements, there is a seven member national Board of
Governors appointed by the President and confirmed by the Senate to
serve 14-year terms of office.
Significantly, unlike the British and Canadian systems,
there is no branch banking in the United States. Rather local branches
retain reserves in their own vaults. Under branch banking reserves are
generally held at head office. The regional nature of the American
experience began as fear by the slave-owning South of the
emancipationist industrializing North. The U.S. simply could not
accommodate a truly national bank or a branch banking system. Failure
of the first and second Banks of the United States as well as the
constitution of the Federal Reserve speak to, among other things, this
regional opposition to national financial centralization.
iii
-
The Bank of Canada
During the pre-Confederation period the provinces of
British North America issued, from time to time, treasury notes that
served as legal tender, e.g., Prince Edward Island in 1790 to
make up for a coin shortage, a common problem among the provinces.
Various private banks also issued banknotes beginning with the Montreal
Bank (later the Bank of Montreal) in 1817.
Under the British North America Act, the federal
government gained jurisdiction over currency and banking and the
Dominion Notes Act came into effect in 1868. The new federal
government assumed responsibility for provincial notes. In 1871the
Bank Act repealed all provincial acts conflicting with federal
jurisdiction over currency and banking. Thereby chartered banks came
under common regulation. The private banks were allowed to issue notes
with a minimum denomination initially of $4. The federal government
issued smaller notes as well as larger ones used mainly for transactions
between banks.
Until the Great Depression of the 1930s there was little
need for central banking in a widely scattered and mainly rural
economy. With the Depression, various bank scandals and a Conservative
Prime Minister’s perceived need for a direct means for settling
international accounts, R.B. Bennett set up a royal commission to study
“the organisation and working of our entire banking and monetary system
[and] to consider the arguments for or against a central banking
institution...”
The result was the Bank of Canada Act of 1934.
The Bank of Canada began operations in March 1935. It initially was a
private corporation with shares sold to the public. The new Liberal
government of William Lyons McKenzie King, however, amended the Act and
nationalized the institution in 1938. The Bank became publicly owned
and remains so today.
The Bank of Canada Act,
which defines the Bank’s functions, has been amended many times since
1934. But the preamble to the Act has not changed. The Bank still exists
“to regulate credit and currency in the best interests of the economic
life of the nation.”
About the Bank, Who We Are,
http://www.bankofcanada.ca/en/about/history.html
Conflicting definition of the “best interests of the
economic life of the nation” between region and metropole played
a conspicuous role in the pre-history and constitution of the Federal
Reserve Board in the United States. It did and does so still in
Canada. The American way is regionalism and local reserves for local
investment. Canada, however, chose branch banking in the British
tradition. And, unlike the Federal Reserve, the Bank of Canada does not
practice regional monetary policy.
The apocryphal “7-to-1” policy of chartered banks in
Canada demonstrates its regional animal spirits. For seven dollars in
deposits in the regions, one dollar is lent back to local enterprise.
In the metropole – Montreal & Toronto – for every dollar deposited seven
are lent back to where the opportunities are and the head office with
the reserves.
Historic, rather than apocryphal, is the constitutional
crisis of 1961 between Governor of the Bank of Canada James Coyne and
Conservative Prime Minister John D. Diefenbaker, Member of Parliament
for Prince Albert, Saskatchewan - formerly ‘the northwest territories’
of Canada until 1905, a.k.a., the regions. Known as the ‘Coyne
Affair’ the Governor publicly criticized the Prime Minister’s
expansionist (Keynesian) economic policies especially export sales to
the United States during a recession and recommended instead higher
interest rates to slow the economy down and eliminate the deficit
(Classical).
Behind the national scene, however, were the regional
political economic implications of the Governor’s view. Diefenbaker in
1957 created the Agricultural and Rural Development Agency (ARDA) so
that federal dollars could help develop the regions outside southern
Ontario and Quebec, the metropole. There lived the majority of the
population and dollars but not seats in the House of Commons.
Diefenbaker’s Conservatives held the regions while his Liberal
opposition held the metropole.
The Conservative House of Commons voted to vacate Coyne’s
employment but the Liberal dominated Senate refused to pass the bill.
Constitutional crisis! Coyne nonetheless resigned. This raises,
however, the whole question of the arm’s length relationship. At that
time the Bank of Canada was at full arm’s length from government
interference. Once appointed the Governor was essentially independent
of the Government of the day. Similarly, the Chairman of the Federal
Reserve and European Bank are shielded from political interference.
They function at full arm’s length. A recent case in Italy where the
Governor of the Bank of Italy was accused of interfering with a foreign
takeover of an Italian private bank demonstrates. He refused to resign
for over five months and only then, I believe, on his terms. As in the
Coyne affair, any political interference causes the animal spirits of
investors, especially foreign ones, to be depressed. As will be seen,
moral suasion is arguably the most powerful tool in the hands of a
modern central bank.
Today, after amendment of the Bank of Canada Act,
the Minister of Finance can order policy changes. Any minister who does
so, however, faces the opprobrium of the investment community with all
its economic and political implications.
Observation #7: Shadow Banking and the Great Recession of 2008
After the Great Depression of the 1930s tight central
banking regulation became the norm at the retail level in the United
States, the dominant player and trend setter in banking and financial
markets around the world. Among other things the federal government in
effect guaranteed retail banking deposits. At the wholesale or
investment banking level, however, regulation flowed from security &
exchange rather than banking legislation.
In the 1980s deregulation became the policy norm and two
major things happened. First, retail banks were allowed to
invest their own money, a.k.a., deposits, in ‘secure’ financial
securities rather than simply making loans or issuing mortgages. In
effect, many became investment banks. Second, financial
innovations at the wholesale level rapidly accelerated, among other
things, spawning the so-called ‘Masters of the Universe’, a term coined
in the 1980s to describe Wall Street brokers in that Age of Greed.
Through conglomeration, de-regulation, financial innovation and lax
public oversight a ‘shadow banking system’ arose beyond the pale of
public scrutiny and arguably beyond accountability becoming, in some
cases, ‘too big to fail’.
Ironically, the most recent investment bubble of 2007-8
is rooted in ‘securitization’ intended to spread and minimize risk.
According to John R. Commons in his classic
Legal Foundations
of Capitalism (1924) property, in
the economic sense of what can be bought and sold, is the history of its
ever increasing intangibility. In this sense, property has become not
so much a thing in-and-of-itself but rather an evolving set of rights &
obligations associated with it, e.g., a warranty. Thus property
today includes intangibles like copyrights on artistic & literary works,
patents on inventions, futures options, equity shares, software and
investment certificates in land and buildings, e.g., ‘CDOs’ or
Collateralized Debt Obligations.
CDOs’are part of a more general and widespread
securitization of property. This is done using probability calculations
derived from physics and mathematics rather than traditional actuarial
calculations. In fact major firms hired high energy particle physicists, mathematicians
and economists right out of school to do the calculations. Title is
created, as a financial instrument, to a mix of thousands of primary
financial instruments such as copyrights, mortgages, patents and student loans. The mix is ‘hedged’ (one primary asset against another
so to speak) to assure a mathematically stable rate of return with zero
to minimal downside risk. Slices or shares in this consolidated
‘exotic’ (now ‘toxic’) instrument are then offered to investors. Title
is granted to a share of the resulting pool.
It is no longer clear, however, what is in any given
instrument, e.g.., how much sub-prime, prime or super-prime.
Their complexity is such that they are not traded to the general public
and therefore not subject to retail security & exchange or banking
oversight. Essentially they are sold wholesale between banks, hedge
funds and investment houses, intra alia. What is being bought
and sold is new exotic and very complicated financial instrument. Their
complexity is such that very few understand the math including CEOs of
financial institutions buying and selling them. But they have ‘the
numbers’. Bond and other rating agencies agreed and initially granted
‘AAA’ ratings to many such securitized financial instruments.
The Big Short
In this regard it is critical to note that physics rests
on the Laws of Nature while financial investment rests on ever changing
human laws and human nature subject to fear and greed. This distinction
extends to the application of mathematics. As economist
Kenneth Boulding
points out there are “limitations [to] mathematics both as a tool and as
a language, especially in regard to possible distortions of the growth
of knowledge”.
In this regard, the Great Recession of 2008 arguably
resulted because of a failure to distinguish between risk and ignorance
and between speculation and enterprise. These are the subjects of
Chapter 12 – The
State of Long-Term Expectations of
Keynes’ General Theory of 1936.
i - Risk vs. Ignorance
Risk involves calculation of the probability of possible
outcomes. It implies one knows what those outcomes might be. Usually
it also involves setting aside ‘Black Swans’, or outriders of extremely
low probability but potentially devastating consequences. With respect
to the Great Recession, this was arguably the case with respect to the
chance that the entire national housing market in the United States
would collapse at the same time. – an extremely low probability but one
with devastating consequences.
Ignorance, on the other hand, defined as the lack of
knowledge, cannot be subjected to calculation. One just does not know.
As Keynes points out in Chapter 12, business enterprise inevitably
suffers ignorance beyond a very short time frame. It is animal spirits
that keep them going concerns, not probabilistic calculation.
ii - Speculation vs. Enterprise
In economics, speculation involves taking risks. And
this can be a very good thing, e.g., insurance, future options,
etc. It can also be a form of gambling in which short-term
trumps long-term returns. In Chapter 12, Keynes compares playing the
stock market – day trading - as a beauty contest in which it is not
choosing the most beautiful but rather the choosing the one that
conventional expectations will choose. This catches the ‘herd
mentality’ of equity markets.
Keynes applies “the term speculation for the activity of
forecasting the psychology of the market, and the term enterprise for
the activity of forecasting the prospective yield of assets over their
whole life” (Keynes 1936, 158). Arguably, bank deregulation beginning
in the 1980s resulted in the merging of the banking and security &
exchange systems. Banks traditionally focused on enterprise loaning
money (deposits) and retaining ownership of primary financial assets,
e.g., the mortgage on a home. With deregulation they began to
engage in speculation by selling off primary assets and acquiring
secondary or derivative assets, e.g., CODs. With both the
banking and security & exchange systems engaged in speculation a
financial bubble was arguably inevitable.
iii -
Securitization: The Sub-Prime Bubble
FEAR &
GREED
The
Sub-Prime Bubble & Its Mates
Harry Hillman
Chartrand, PhD
Revised
March 6,
2008
The most
recent investment bubble of 2007-8 is rooted in the
'securitization' of Property. From the perspective of cultural economics Law is
not a technical subject but rather a cultural artifact arising from the unique
historical experience of a specific culture with its distinctive patterns of
custom, habit and life ways (Schlicht 1998). More to the point, each system of
Law has its own definition of what can be bought and sold, i.e., What is
Property? This contrasts with other things that are not Property especially
People.
Today, legal title to Property usually takes the
form of a document, deed or certificate establishing the right to possession.
The coercive power of the State protects and defends it. There
are three forms. There is immovable or ‘real’ Property such as
land, buildings and fixtures which together with moveable Property or ‘chattel’
(derived from the Anglo-Saxon for cattle) constitute tangible Property.
Then there is intangible Property such as business ‘good will’, stocks,
bonds and intellectual property such as copyrights, patents, registered industrial designs
and trademarks. Each involves associated rights &
obligations granted by and subject to the pleasure of the Sovereign -
Crown or State. Each consists of differing bundles of rights &
obligations, e.g., the differing term for a patent and a copyright
or between allodial, freehold or usufruct (tenant) title to real Property. [1]
John R.
Commons observed in his classic
Legal Foundations of
Capitalism
(1924) that Property, in the economic sense of what can be bought and sold, is the
history of its ever increasing intangibility. In this sense, Property has
become not so much the thing in-and-of-itself but rather an evolving set of
rights & obligations associated with it, e.g., a warranty. Thus Property
today includes intangibles like artistic & literary works, inventions, futures
options, equity shares, software and investment certificates in land and
buildings, e.g., ‘CDOs’ or Collateralized Debt Obligations including an
unknown number of sub-prime mortgages. Such intangible income earning Property
is arguably the legal foundation of the knowledge-based economy (Chartrand
2007). According to Commons, the transition from tangible to
intangible Property began in the 1700s with recognition, under Common Law,
of business 'goodwill' and copyright as income earning assets. What is bought
and sold, in effect, is the expectation of profit, e.g., of a going
concern.
'CDOs' are
part of a more general and widespread securitization of Property
intended to spread and minimize risk. This is done using
probability calculations derived from physics and mathematics rather than
traditional actuarial calculations. [2] In fact major firms hired high energy
particle physicists and mathematicians right out of school to do the
calculations. Title is created, as a financial
instrument, to a mix of thousands of primary financial instruments such as
copyrights, mortgages, patents and even student loans. The mix is 'hedged'
(one primary against another so to speak) to assure (mathematically) a stable
return with zero to minimal downside risk. Slices or shares in this
consolidated 'exotic' (now 'toxic') is then offered to investors. Title is granted as
a share in the resulting pool.
As
demonstrated in an article by the
Economist,
"Securitization:
Fear and loathing, and a hint of hope"
February 14, 2008 it is
no longer clear what is
in any given instrument, i.e., how much
sub-prime, prime or super-prime. Their complexity is such that they are not
traded to the general public and therefore not subject to 'retail' security &
exchange as well as banking oversight. Essentially they are sold bank to bank, hedge fund to hedge
fund, investment house to investment house, intra alia. What is being bought and sold is new exotic
and very complicated financial instrument designed to securitize
all income earning Property. Their complexity is such that very few
understand the math including CEOs of financial institutions buying and selling
them. But they have 'the numbers'. The bond and other rating
agencies agreed and initially granted 'AAA' ratings to many such securitized
financial instruments.
The 'dotcom'
bubble of 2001 demonstrated the need for the U.S. Government to regulate
the accountancy industry and its clients following the collapse of Arthur Anderson, the fifth largest global accountancy
(see the
Sarbanes-Oxley Act) .
Arguably, the 'sub-prime' bubble demonstrates the need for tighter banking and
investment regulation. Why? Simple: Fear & Greed. For whatever
reasons investors periodically, throughout capitalist history, come to believe that
what goes up does not come down and that the business cycle has ended and there
are only blue skies above. This was a theme of the dotcom bubble, i.e.,
the so-called 'New Economy' based on the internet. When the sky falls the
investment community tends to duck for cover in what was called 'a bunker
mentality' after the dotcom bubble burst. Fear & Greed are facts of
financial life. It is not just cold calculation that motivates investment
decision but also raw emotion. Financial loss is right up there with sickness
and the emotional loss of a loved one. Financial gain, at the extreme of pure
gambling, is arguably as addictive as hard drugs - the rush. Ego deflation and
inflation naturally follow. Short-run speculation rather than long-run
enterprise too easily becomes the game [3].
Creation of
the Bank of Canada in 1935 represented recognition that the financial community
could not be trusted to contain its 'animal spirits' and 'excessive exuberance'
while Government could not be trusted to keep its hands off the printing press.
The Bank represents a new 4th order of Government - executive, legislative,
judiciary and central bank. In effect it represents a marriage between
Government and Finance in the money market of a capitalist economy. Tight central banking and security
& exchange regulation were, until recently, the norm. Recent deregulation arguably
went too far and did not kept up with financial innovations trading between 'Masters of the Universe'
(a term coined in the 1980s to
describe Wall Street brokers in that Age of Greed). Through
conglomeration, de-regulation, financial innovation and lax public oversight a 'shadow banking system'
has been created beyond the pale of public scrutiny.
Government's
role, cum Keynes, is not to inhibit risk taking and financial innovation
but to compensate for the bi-polar animal spirits of investors and hence the
extremes of the business cycle through 'workable' regulation. This requires,
however, recognition on the part of the financial industry itself of a self-felt public
responsibility given its privileged status in a capitalist society - noblesse
oblige. Arguably there is a generalized need for heightened public accountability and transparency, not just
on the part of
Government, [4] but also all self-regulating professions, e.g.,
accountants, architects, engineers, lawyers and physicians.
The market works on what Adam Smith called 'moral sentiments' or what today we
call ‘market trust'. Trust is a two-way street. And in
the current crisis it is lack of trust between banks that is fueling the ongoing
problem. In effect we are in an institutional liquidity trap.
Interest rates are zero but no one will invest. When one bank is asked to
borrow from another, the potential lender looks at a balance sheet that shows
securitized assets whose
worth cannot be easily determined. Therefore banks will not lend to banks and the
entire financial system seized up and its effects are now rippling through the
'real' economy.
Just before
the fall of Communism this need for accountability and transparency of all
self-regulating agencies of the State including the Party - the leading vanguard
of the Revolution - was called perestroika
and glasnost. Arguably, the same is needed for the troubled
capitalist world order. The 'off loading' of responsibility for the public
purpose into semi-public/private hands (the pattern of 'privatization' since the
days of Margaret Thatcher, Ronald Reagan and Brian Mulroney), does not relieve
Government of responsibility for monitoring and regulating performance. The problem and suggested solutions are
presented in
my book review of
Government by Moonlight -
Hybrid Parts of the State (Birkenshaw, P., Harden I. & Lewis, N.,
Unwin Hyman, London, 1990). For my part,
as a Canadian, one possibility is Senate reform inclusive of the self-regulating
professions that, through secret ballot, each would elect their own Senator as
representative of the profession before the people of Canada.
[1] For a
fuller exploration of Property in the Anglosphere please see my recent article
"Equity
& Aboriginal Title", Compiler Press, January 2008.
[2] It is critical to note that physics rests on the Laws of
Nature ewhile financial investment rests on human laws and human nature, both
culturally expressed.
[3] This distinction between short-term speculation, e.g.,
on the stock market, versus long-run expectation of enterprise, i.e., between
nominal and real gains, was a central theme of Keynes' analysis of the
Great Depression. See
Chapter 12
of his General Theory.
[4] For my views on what are the continuing inadequacies of the
federal and provincial system of Budget, Estimates and Public Accounts please
see: “The
1995-96 Federal Cultural Budget“, Government Information in Canada,
University of Saskatchewan, Winter 1995.
http://www.usask.ca/library/gic/v2n3/chartrand2/chartrand2.html
Observation #8: Jeremy
Bentham
Contemporary Economics is rooted in the 17th century
Scientific Revolution in England. What we call the natural and
engineering sciences were then called ‘experimental philosophy’. This
new way of looking at the world gained legitimacy with Charles II’s 1662
Charter to the Royal Society of London for the Improvement of Natural
Knowledge. The Scientific Revolution then began in earnest with
Isaac Newton’s clockwork universe serving as its icon. This
materialistic meme rapidly spread across Europe.
The ascent of experimental philosophy left moral
philosophers (those today we call social scientists and humanists)
searching for the social equivalent of Newton’s clockwork universe.
Arguably it was uncovered by
Jeremy Bentham (1748-1832)
founder of the last great school of philosophy to emerge from the
Western
Enlightenment -
Utilitarianism.
His answer was the greatest good for the greatest number
measured by atomic units of pleasure/pain called utiles with
pleasure and pain serving as “sovereign rulers of the State” in
Bentham’s words. The greatest good was to be calculated using Bentham’s
felicitous calculus, the calculus of human happiness.
While we will consider Bentham’s contribution to
economics it is important to note that the impact of his thought was
much wider. Thus among his disciples were the Philosophical Radicals
who became the Liberal Party of the United Kingdom. They used Bentham’s
felicitous calculus to institutionally transform England and its Empire
from a feudal into an Administrative State. Their achievements, among
others, included: constitutional and local government reform, the end of
slavery; responsible government in Canada, universal suffrage; the
supremacy of the legislature (or ‘legislative omnicompetence’ in
Bentham’s words), compulsory public education, health and safety; penal
and criminal law reform including a modern police force; welfare reform;
and, founding, in 1826, the first English research university and the
first to accept non-Anglican, non-male and non-white students –
University College London. These achievements were based on the premise
that the happiness of a pauper is equal to that of a prince expressed in
the euphemism: An Englishman’s home is his castle. Liberal democracy in
fact took root in England through Benthamism dodging the Republicanism
of the United States and France.
Bentham’s philosophy is rooted in Epicurean
sensationalism. Epicurus
(341-271 BCE) was a contemporary of Aristotle and Plato who both
believed in the gods but Epicurus did not. Bentham acquired his view
from the
De Rerum Natura (On the Nature of Things) by the Roman
Epicurean poet Lucretius (99-55 BCE), whose work, unlike those of
Epicurus, survived the fall of the Roman Empire and the censorial fires
of the Church.
Like Epicurus, Bentham believed that physical sensation
was the foundation of all knowledge. Knowledge, including
preconceptions such as ‘body,’ ‘person,’ ‘usefulness,’ and ‘truth’, form
in the material brain as the result of repeated sense-experience of
similar objects. Ideas are formed by analogy between or compounding
such basic concepts (O’Keefe
2001).
For Bentham sense experiences involved a unit measure of
pleasure and pain called the ‘utile’ that eventually, according to
Bentham, would be subject to physical measurement. One corollary of the
utile, however, is that customs, traditions and taste cease to be
independent variables. For Bentham compulsory public education would
begin with children taken at birth from their mothers and placed in
state-operated crèches. Each child was, Bentham believed, born
tabula rasa – blank – and compulsory public education would ensure
everyone’s customs, traditions and taste would eventually become
identical and therefore irrelevant. He also innovated the
Panopticon, an architectural form that allowed the observation
of convicts in prison cells (Kingston
Penitentiary)
is an example and designs for observing the
educational life of children and civic life in general by a hidden
observer.
Bentham believed that human
existence was simply the search for pleasure and the avoidance of pain.
Thus utilitarianism is radically materialistic. Even aesthetics shrank
to analysis of pleasurable sensations evoked by a work of art. A thing
is beautiful because it pleases, it does not please because it is
beautiful (Schumpeter 1954, 126-7). This, combined with emphasis on
functionality, meant application of artistic effort was “irrational”.
In industrial design and architecture, this aesthetic reached its
conclusion in the aphorism form follows function, the
Bauhaus and the glass and steel towers of the International School
of Architecture (Hughes 1981).
In many ways, Bentham makes Karl Marx look like a weak
kneed bleeding heart liberal. Marx would have admired John Lennon’s
working class hero. Bentham, on the other hand, wanted to socialize not
just the means of production but also of consumption. For Bentham the
Mao suit or ‘GI’ issue - one size fits all - was the style of the
future. It was only the terrors of the French Revolution that drew
Bentham back from perfect communism. For Marx, on the other hand,
Revolution was the instrument of change. In a sense, Marx was the son
that Bentham never had
The formal name for Bentham’s utilitarianism is
Ethical Hedonism. The search for pleasure (hedonism) was inhibited
in Bentham’s scheme by assuming human beings carried a genetic sense of
right and wrong, good and bad - essentially the Protestant work ethic.
Once that ethic fades, however, we are left with ‘Me-ism’ socially
expressed as ‘Consumerism’.
In 1881
Francis Ysidro Edgeworth (1845-1926) married Bentham’s felicitous
calculus of human happiness to Newtonian calculus of motion and reduced
it to geometric expression subject to mathematical proof in his
Mathematical Psychics. At root this marriage succeeded by using
Bentham’s reification (making concrete that which is abstract) of
happiness as money – the presence of money brings pleasure, its absence
brings pain. One’s willingness to pay $10 for a DVD is a measure of the
utility or happiness one hopes to derive from it.
Edgeworth’s geometry and its related calculus
permitted erection of what became, in the hands of
Alfred Marshall, the Standard Model of Market Economics. It shifted
the focus of economics from analysis of the distribution of national
wealth among different classes in society to the constrained
maximization of utility by consumers generating the Demand Curve and the
constrained maximization of producer’s profits generating the Supply
Curve with ‘X’ marking the spot where the willingness to buy (Demand)
exactly equals the willingness to sell (Supply). The market clears.
This is where
the greatest good for the greatest number is achieved in the
Standard Model of Market Economics.
It is important to note that use of calculus defines the
Standard Model as mechanical rather than biological in nature, i.e.,
the calculus of motion, in this case, of human happiness. It is also
important to note that the demand-side of the economic equation came
first and flowing from it the supply-side was subsequently erected. Put
another way, consumer's wants, needs and desires in the Standard Model
precede production of goods & services to satisfy them. This is
sometimes called ‘consumer sovereignty’ or ‘dollar democracy’. In this
sense the consumer/producer-centred Standard Model of the late 19th
century allowed economics to catch up with the citizen/voter-centred
Republican Revolution of the 18th century.
It is ironic that Bentham-inspired economics should
achieve what Plato most feared about the Arts as expressed in Book X of
The Republic:
We must remain firm in our conviction that hymns to the
gods and praise of famous men are the only poetry which ought to be
admitted into our State. For if you go beyond this and allow honeyed
muse to enter, either in epic or lyric verse, not law and the reason of
mankind, which by common consent have been ever deemed best, but
pleasure and pain will be the rulers in our State.
It is not, however, just the Ancients who have (or would
have) concerns about Bentham’s felicitous calculus and the Standard
Model.
Joseph Schumpeter called it “the shallowest of all conceivable
philosophies of life that stands indeed in a position of irreconcilable
antagonism to the rest of them” (Schumpeter 1954, 133).
John Maynard Keynes went further identifying its dangerous
ideological flaws:
I do now regard that as the worm which has been gnawing
at the insides of modern civilization and is responsible for its present
moral decay. We used to regard the Christians as the enemy, because
they appeared as the representatives of tradition, convention and
hocus-pocus. In truth, it was the Benthamite calculus, based on an
over-valuation of the economic criterion, which was destroying the
quality of the popular Ideal. Moreover, it was this escape from
Bentham... which has served to protect the whole lot of us from the
final reductio ad absurdum of Benthamism known as Marxism (Keynes
1949, 96-7).
In fact, before the Republican Revolutions of the 18th
century the economy was embedded in society through guilds and a class
structure of subordination by birth. Today, many fear that human
society is being embedded into a global economy in which everything is
for sale – children, hearts, kidneys, lungs as well as the entire
natural and human built environment – as Karl Polanyi suggested in
The Great Transformation (2001). Such lingering concerns may be
genetic fragments of a not quite dead Marxism or remembrances of
forgotten roots - in the United States, “Life, Liberty and the pursuit
of Happiness” and in France, “Equality, Fraternity and Liberty”.
In a way, the Republican Revolution overthrew an ancient
regime of subordination by birth gaining political freedom for the
individual and in the process spawning the free self-regulating market
as its economic corollary. The Communist Revolutions of the 20th
century, on the other hand,
sought economic freedom for the individual (each according to one’s
need) through a centrally planned and controlled command economy and
spawned the one-party Leninist State as its political corollary.
Arguably, both freedoms – political and economic - are necessary, if not
sufficient, to fully realize human potential.
Non-linked References
Hughes, R., The shock of the new, Knops, NY, 1981.
Keynes, M., Essays on John Maynard Keynes [1949],
Cambridge University Press, Cambridge, 1975.
Schumpeter, J. A., History of Economic Analysis
(1954), Oxford University Press, New York, 1968.
For more on Bentham, the 'Marx & Lenin' of Capitalism, please see my MIDAS
Lectures:
Secularization of the West & The Rest: The Legacy of
Jeremy Bentham
Part I Establishment
November 2012
Part II Disestablishment
April 2014
|
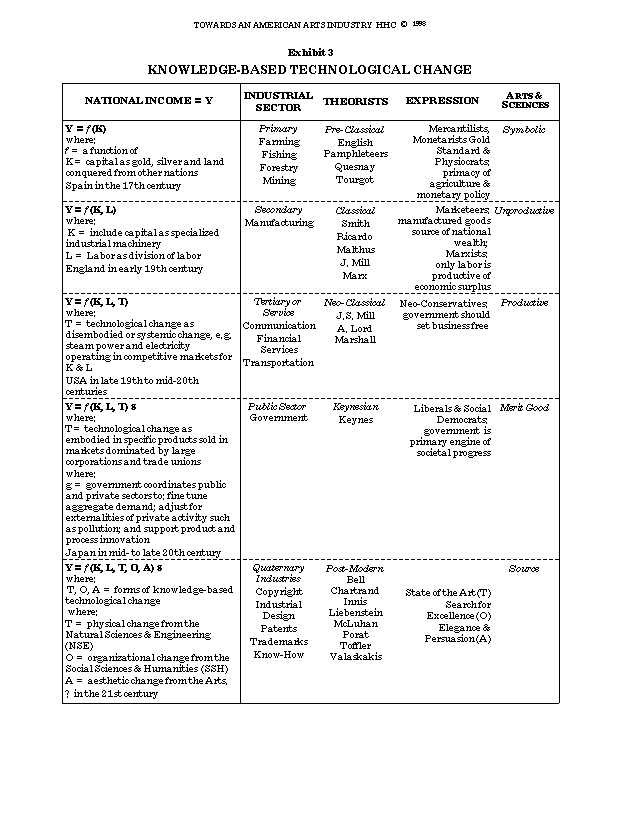
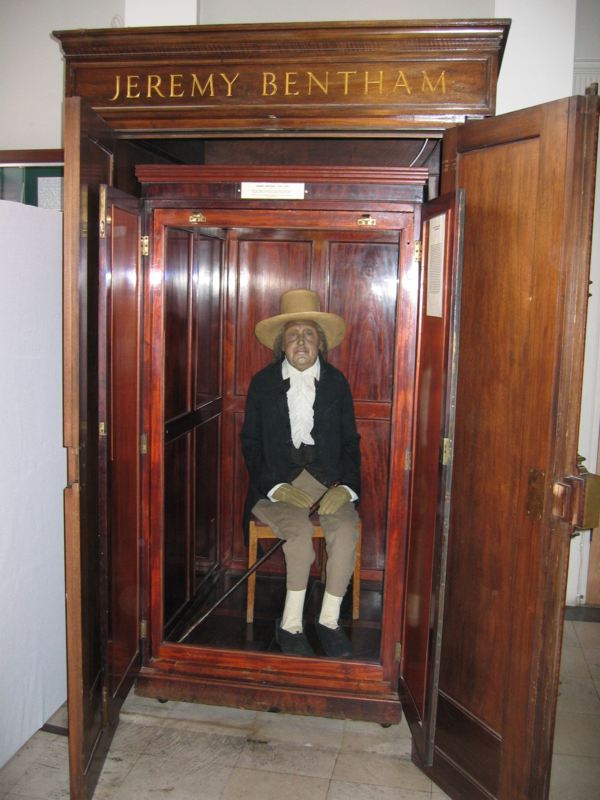
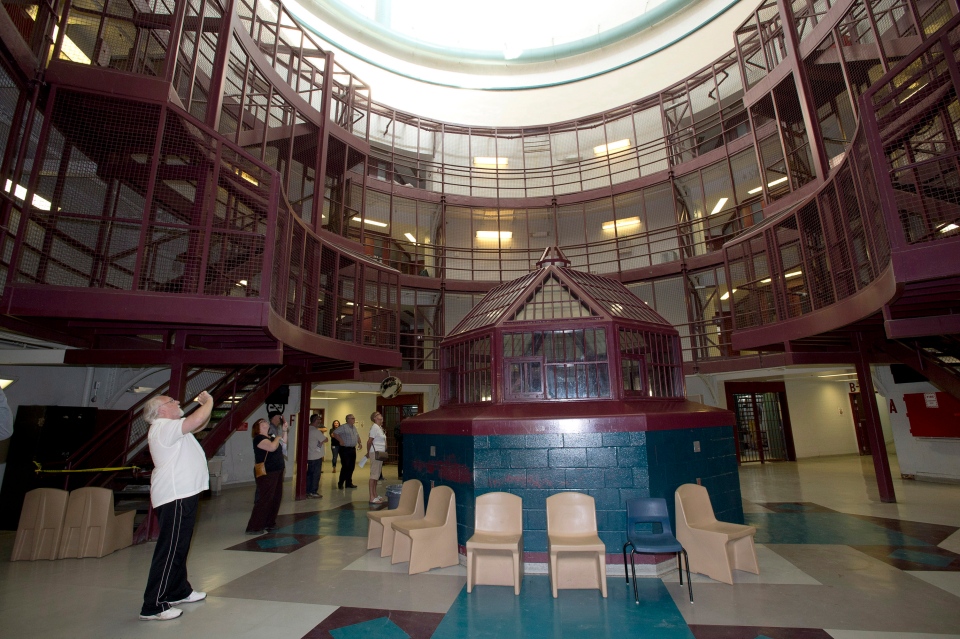